Excel - Time Series Forecasting - Part 2 of 3

HTML-код
- Опубликовано: 21 авг 2024
- Part 1: • Excel - Time Series Fo...
Part 3: • Excel - Time Series Fo...
This is Part 2 of a 3 part "Time Series Forecasting in Excel" video lecture. Be sure to watch Part 1 before watching this part and Part 3 upon completing Part 1 and 2. The links for 1 and 3 are in the video as well as above.


You are a born teacher. Most professors, teachers, lecturers teach to a limited audience, like brightest students. Your teaching targets 100% of the audience.
The theory is sharp and precise and the examples are simply to the point. This 3 part video is easy to understand and practise. Highly recommend this time series tutorial
Thank you so much! You are an amazing teacher! My teacher is dull and just clicks the buttons in class without really explaining anything. He goes so fast that I don't have time to form questions. This was a great video explaining time series forecasting, that I have to know for my exam next week. You rock!
I don't usually comment on videos but this one deserves all the positive comments and likes . You are a very good teacher.
👏👏
This is brilliant.......Application component explained the simplest possible way!!!!!!!! I knew nothing about time series data but this video is illuminating........I read more than 20 papers to understand ARIMA model and no paper could better explain than this video........ Thank you from Nepal
Statistics is complicated, but speacial sound and visual effect with the perfect teaching technique, you made it look so easier. i loved this video, thank you
It has been an amazing experience watching your video and learning..... because I believe you are an amazing teacher !.... because you know your subject inside out .... just like the back of your palm ! It is very kind of you to have made this exceptional 3 series video for people who know nothing about this. Thanks on behalf of every one and God bless !
the most amazing excel tutorial I have ever seen!
God bless you sir 😂🙏🏽🙏🏽 I literally don't understand my lecturer who has a foreign accent, I'm so confident after watching your video 💯💯💯💯💯🙏🏽😭😭😭
cant wait to see the monthly forcast, thanks for your sharing.
This is a GREAT SERIES! Thanks so much!
Excellent series of videos, makes time series easier to understand. Thank you!!!
Great video and very clear explanation! By reading comments below, i finally figure out where the "It" migrates to. Maybe it's better to mention that in your video and there will be less confusion. However, that does not change the fact that it's a well structured and detailed video tutorial. Thank you!
You have no idea how much you helped me
10 years later and still saving people.
Man you saved my life!!! or Lecturer was tying up our brains man Thank You !! You do Queuing?
if you have monthly data, is it recommended to use a 12 month moving average? I noticed you said you selected MA(4) because the data was quarterly
Excellent video! I look forward to viewing others.
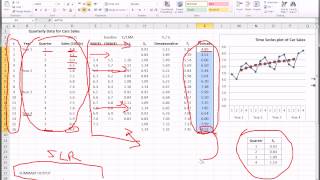
The four quarterly means should theoretically add to 4, because the average is set to 1. The total of the four may not be equal to 4 due to rounding. Like in this case the add to 4.007
In such cases the correction factor is then applied to each of the 4 means to force them to total 4.
This is just a small addition, it must be noted that small deviations also affect the precision of decision making.
+Presley Ncube
correction factor = 4/4.007 = 0.9983
then we multiply all these four seasonal indexes
Your videos are excellent to explain the method...thanks and congratulations!!
Thank you for excellent discussion and adding some theory.
watch video 1 in this series of 3 videos and/or pick up a statistics textbook with a chapter on Time Series Forecasting, hope this helps
thank you very much. easy to understand.
Excellent content and instructions
u r the best ever
Fantastic explanation. could not get any clearer than that!
WONDERFUL explanation! 👏🙌
You are a great teacher . I'm comfortable with R because of your videos. Btw, have you created a time series using R video?
Thank you lesson_02 completed.
VERY CLEAR AND UNDERSTANDABLE!
Thank you, this is going to help me a lot!
Thanks for these wonderful tutorial.I took same sales values, loaded in r and decompose to check trend,seasonality and irregular components and found the values are different from what you are showing here. Any idea how decompose function in r calculates these components?
thank you very much
please upload more videos like these, they are very helpful!!!!
superbly fantastic
Thank you so much this was so helpful!
It is wonderful, thank you very much! can you suggest: what attitude of forecasting suitable for forecasting sales in 400 store in shops?
Thank you very much. Excellent work!
Thank you this help me a lot
Thanks for the vid!
Will this work if I happened to have only 1 year of data?
This is an excellent video. You didn't scale your seasonal index. Why is that? Add up the values to see if they add up to 4 exactly. If they do not then adjust them. St X (4 / actual sum).
Thanks a lot
Is it true that as long as i have quarterly data (sales/index etc), i can use this method for forecasting?
12:53 - 13:00 - like your effects
You get rid just from sezonality at the end. Irregularity remains, if I understand well.
just perfect
If I am doing for week over week data then how can I select my MA, CMA and build the seasonal component table ? Should I use 4 weeks ?
I'm wondering the same thing.
Hi. Jalayer. Can you please run this forecasting on epidemic data. I mean starting from case zero here will be no seasonality butbtrend and irregularity factors will be there
What if the unpredictable happens and there is a hail storm or something that hinders the sales of each quarter into year 5? How do you reflect that? I know you can predict the likelihood based off of empirical observation, but where does that come into play in adjusting the analysis?
Thank you @Jalayer Academy, this video gives some insights. But I have one question.
What if my data is a yearly time series data, which has no seasonal pattern like in the video?
.
Thank you so much, I hope you respond this one question with some answers.
1 year might be a little too few data points to get anything meaningful, you may still be able to get some results
which criteria do you use to select a 4 point moving average over say 3 point moving average
seasonality...
Thank you so much!! It's really helpful
thank you for the video, and can you put up an exponential smoothing model? :)
My thought is along the same lines as Karthik's. What if the sales figures were annual instead of quarterly? It would be helpful if we could download example worksheets.
in a data such that revenues of years ( 2012 - 2013 - .... - 2019)
we do not need to:
1- calculate MA(4) and CMA(4) right??
2- Yt/MA(4) will be the same revenues right?
U r awesome! I finally understood
What would you modify if you had similar data but by month?
Change Quarter to month/period and create 12 rows per year
For column H - St - couldn't you simply use averageif and not create a new table to the side?
=AVERAGEIF($C$4:$C$19,C4,$G$6:$G$17) 10:50
If you're doing the multiplicative model for time series, does this mean that this doesn't relate to the the mixed model for time series??
I have set this up as a model for Months (Jan-Dec) rather than Quarters. I used MA(12)/CMA(12) and started the MA at t7 (July). Is the principle the same, so the steps can be followed the exactly?
awsome stuff bro :)
In the last step, u deseasonalised the data, Yt/St and irregularity component is still there, but u mentioned that we got rid of irregularity..
Simply excellent
sehr gut beschreiben / very well described
thank u for this good lesson
my data shows like this intercept: 3.3829056 and t : 0.00888142
and p value of intercept :4.4276E-06
and that p value of t: is 0.857206584
what do it do? should i carry on or what else... cause my p value for slope is greater than .05 but that of intercept is not,,,,,, please answer me plzzz
Jalayer, thanks for the amazing videos! I was just wondering how to calculate or isolate the seasonal component in the calculations when the sample data in not in the format in your video. In order words, if the data in hence there's no quarterly markers as in the data set in your video. How does one account for the seasonality in the calculations using the classical multiplicative model ? Thanks
what is the difference between smoothing and deseasonality ,both values are almost the same
Thank you from2022
Is this method recomended when time period is monthly and not by quarter?
Mine is showing the blank cells as zero? help
Can we forecast the sales for the year 6,7,8 and so on based on this analysis?
your video helps me a lot. but how can i do a forecast for weekly data? by using 13 weekly data to forecast for the next 1 week demand. thanks :)
Can you explain how you got to the seasonal average?
What model does this solution fit to? Because I am kinda confused here. I have been working with additive systematic component(level+trend+seasonal factor) and with models such as Moving Avg, Simple Exponential Smoothing, Holts Model and Winter's model. I feel like your solution is Winter's model which i dont have much info about. But you are using all in one thats why im confused. Could u help me figure it out?
How does one isolate the irregular or random component?
thanks a lot!
Dr.Jalayer! Help, please! Can I do time series forecasting with only yearly data? Does that mean I don't have to do the CMA step? Thank you so so much!
is there a video where i can learn more about time lags and first differences etc?
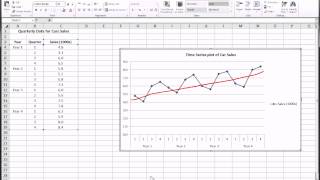
Frustratingly, I can't get my forecast trend line to mirror my existing data. I have a feeling because its th elinear regression formula - my data simply isn't linear! :(
The professor should just say this and the three credit course will be a simple 1 credit course
Can anyone help me to understand, how averaging same time period of every year will get rid of "It" from "St,It"?
Which playlist is this video part of?
Can you make more videos on time series?
What if you don't have a seasonal component (set pattern) ? How do take out the seasonality ?
Jason Mathew If there is no seasonality there is none to get rid of you can estimate the trend component.
+Jalayer Academy What if there are no seasonality but I have irregularities?
So my questions is, how come everywhere i look the forecast is always in the Qtr? Is this method not working for monthly sales?
Sure, monthly is very common too. Im guessing the reason why people don't use it to teach the concepts of forecasting is the lengthy nature of dealing with 12 month seasonal components versus just 4 quarterly ones. Otherwise, same principles.
What if there is no particular Seasonality in the data?
Karthik Khanna no need to remove what is not there, go straight to trend estimation
thank you!, anyway you took a long time to comment
glad this helped
nice video.. ty :)
Do you have a video on using Monthly data year over year instead of Quarterly?
+Money Man I am working on it. Currently doing a lot of ANOVA, and Machine Learning videos.
Thanks for the quick reply! Looking forward to viewing it! Keep up the excellent work!!!
Couldn't you just use 12 periods per year instead of 4 or will that affect the data?
Sebab dia seasonal secara sekata
Why does I fall out in the notation from column G to H? Where does the irregular component go?
by averaging over the respective quarters we mitigate the effect of the Irregular component
Jalayer Academy so this is Assm: E[e] = 0
Jeff van Geete would it be appropriate to think of the difference between G and H as I(t)?
Jeff van Geete when we average all the seasonal components for each quarter we are in effect mitigating the irregular component and offering the average and the irregular-strip seasonal component
Why year 2 quarter 2 is below 16%? how to get there?
How come there's not Cyclical component?
How can work with you on a market share forecast? Thanks
Thanks! How can I do the same forecasting with monts? Shold I count MA(12) because there are 12 months in the year? or not?
thanks a lot,can up please share any references for these videos
hi, everyone. Can i forecast with Excel 2007, or 2010? I need a software to forecast demand of Call Center.
What if there's no seasonality?
what is the name of this model????