The title of this video is "Using the t Table to Find the P-value in One-Sample t Tests", and the video addresses that specific topic. I discuss alpha in other videos.
Hi there. I am an international student and I am taking Stats this semester. So fat, I never understood what the concept of this chapter and previous chapters. Therefore, I looked up the solution manual and tried to search the definition with calculation problems. However, it was really difficult to understand. Once I stepped in here, my brain wakes up and everything is clear now. I mean, thank you for sharing this fantastic video and I can not wait to test following Monday. Again, thank you so much for this awesome video,
Great explanation. Simple, clear, and to the point. It made it really easy to understand... i wish we had you and RUclips 15 years ago when I wast in HS.... lol
Holy crap this vid actually saved my life, good thing there was an example of the exact kind of problem. Wouldn’t have gotten that one answer right on khan academy lol
I just did an exam where the t-value was 5.1, and the degrees of freedom was 147. t-values go up to 5.0 in the statistical tables, couldn't figure out how to handle it. Most of the other questions the t-values or z values were not in the table, but were somewhere between consecutive t values, which made finding p and other values very time consuming. To be honest I wasn't really ready for these challenges. Well, back to the shed for more practice.
Thank you so much!!! I watch two other videos and they didn't help AT ALL!! I finally understand this and can do it for my test Monday!! You are amazing!
Is there any difference in the computation of t-value for right-sided hypothesis/left-sided hypothesis testing. For a given dataset, I can derive a t-value with SD/(sqrt(n)) which would be the same for both left/right sided hyp testing. Then according to you, the p-value on the other side of the test would be (1-Alpha). I am just wondering if the p-value just differ based on the side we chose to test?
I don't use linear interpolation in this situation because it's not a linear function. I think it might be misleading for some students and in my opinion it's just not worth it. Cheers.
Hello I have this question... when you're calculating the t value of a t distribution, under a null hypothesis for a 2 tailed test, would you always get a negative value of t (like in 4:14, the t=-1.31)? and why?
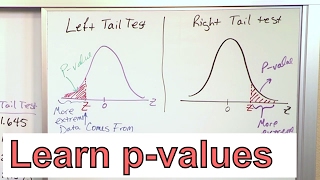
This may be a silly question but in 4:44 how did you know to look at the left tail and not the right tail? do you just look at the smaller tail? Very helpful video btw, thanks.
For the alternative hypothesis with > you look at the right tail ex. U(mean) > 2 = Right tail test For the alternative hypothesis with < you look at the left tail ex. U(mean) < 2 = Left tail test. For the alternative hypothesis with "does not equal" you look at both tails (Multiply P Value by 2) ex. U (mean) =/ [does not equal] 2 = Two tail test
For t = -1.58 and t = -1.82, it means that the interval of P-value should be same but there is a different p-value in a book for t = -1.82 (for 7 degree of freedom) which is outside of the interval [0.1, 0.2]. Why?
It's not a linear function, so you won't be able to determine the exact p-value that way. Some people do recommend approximating the p-value in such a fashion, but I don't. (I don't think it's worth it, and we typically use software to find the exact p-value.)
@@jbstatistics Yes, I'm aware of that sir. But in the video we got negative t from the two-sided test, isn't it should be different for one-sided test?
You're not using the t-table to find the p-value in this video. You still calculate it from software. Maybe you should rename this video to "Using the t-table to obtain a very rough estimate of the P-value in one-sample t-tests"
I discuss that in other hypothesis testing videos (e.g. ruclips.net/video/m6sGjWz2CPg/видео.html). This video is dedicated using the t table, and so I don't get into any of the concepts.
omg help guys, my tstat i found is -0.9318. I looked at the table and it's only positive values. how do i find the p-value from this and my d.f is 17. Help please =(((
That would depend on the calculator, and typical calculators do not have the appropriate function. The tables exist because these values are found with software, and people do not always have access to appropriate software. A calculator along the lines of a TI-83 would have a function to do it. A typical $10 calculator will not.
I didn't teach how because it's impossible. If you want the actual p-value you need to use software. Some people use linear interpolation to approximate it, but I think that's a waste of time and misleading.
As the title implies, this video is about using the t table to find the p-value in one-sample t tests. In many settings (t tests included), there isn't a formula that enables us to calculate the p-value without using software or a table.


The title of this video is "Using the t Table to Find the P-value in One-Sample t Tests", and the video addresses that specific topic. I discuss alpha in other videos.
A simple, easy to understand explanation of t-table usage. Thanks!
I literally could not understand this concept in my stats lecture, so frustrating, but this has helped me immensely! Perfect for finals!
I'm glad to hear it helped you Molly!
Got my resit tomorrow and still don't think I understand half of the equations.
tomorrow's my exam so here i am! laziness is a disease that's hard to cure lol
+RAY S lol
me right now
watch this you'll change ruclips.net/video/arj7oStGLkU/видео.html
@@اطلبالحقوالرحمة This was so helpful, thanks for sharing
me right now
Hi there. I am an international student and I am taking Stats this semester. So fat, I never understood what the concept of this chapter and previous chapters. Therefore, I looked up the solution manual and tried to search the definition with calculation problems. However, it was really difficult to understand. Once I stepped in here, my brain wakes up and everything is clear now. I mean, thank you for sharing this fantastic video and I can not wait to test following Monday. Again, thank you so much for this awesome video,
+ryan andie You are very welcome Ryan! I'm glad I could help. Best of luck on your test!
sana all
I must say that I am blessed I found your videos.
You are doing great job. God bless you !!!
I was struggling with this for a good hour, Thank you so much man!!
same bru
me too
Great explanation. Simple, clear, and to the point. It made it really easy to understand... i wish we had you and RUclips 15 years ago when I wast in HS.... lol
Thanks for the kind words!
Holy crap this vid actually saved my life, good thing there was an example of the exact kind of problem. Wouldn’t have gotten that one answer right on khan academy lol
I just did an exam where the t-value was 5.1, and the degrees of freedom was 147. t-values go up to 5.0 in the statistical tables, couldn't figure out how to handle it.
Most of the other questions the t-values or z values were not in the table, but were somewhere between consecutive t values, which made finding p and other values very time consuming. To be honest I wasn't really ready for these challenges. Well, back to the shed for more practice.
Many thanks from a 3rd year engineering student, taking stats!
And I am 1st year Business Administration Student!!! WHY THE FUCK AM I DOING THIS??
@@gregtheflyingwhale political communication student here, I don't even question it anymore lmao
@@Dertador good luck man....
Thank you so much!!! I watch two other videos and they didn't help AT ALL!! I finally understand this and can do it for my test Monday!! You are amazing!
+TheGamefreakgame You are welcome, and thanks! Best of luck on your test!
+jbstatistics since I'm watching your videos, I'm sure I'll do fine :D
Thanks so much, you explained it better than anyone that I have looked at.
I'm glad to be of help!
Excellent , Explanation and example are awesome, Thank you very much
Just wanna say thanks for making the video. It was very helpful! I hope you keep making them
Brilliant thankyou so much. I am a university student studying mathematics and needed to refresh my memory on p values
So glad I found your video. It was very easy to understand, thanks for the help.
I literally have a collection of your videos under the folder name JBTheGod! Thank you man!!!!
great video thanks
You are very welcome Vinayak. And thanks very much for the blessing!
Thank you very much!!! I'm so glad I finally understand how to find this pvalue from the table
+Mohamed Boujnah I'm glad I could help!
Simple explanation.. straight to the point... Great job... thkx ya..
You are very welcome Winson.
Very good explanation sir 🙏🙏🙏
Excellent work with this video - crystal clear now. Thanks!
+Polgur, Michael You are welcome, and thanks for the compliment!
Okay. This video is the best I can do on this topic.
hi
please speak
Thank you jbstatistics. These youtube videos are a big help!
You just saved me . . . a lot of time, thank you so much kind sir!
I'm glad to be of help!
Thank you.. Like others, I was struggling with this and now I've got the concept.
Thank you very much for solving my problem!
Have a nice day!
This video saved my butt! thanks dude! very clear explanation
You are welcome David.
Is there any difference in the computation of t-value for right-sided hypothesis/left-sided hypothesis testing. For a given dataset, I can derive a t-value with SD/(sqrt(n)) which would be the same for both left/right sided hyp testing. Then according to you, the p-value on the other side of the test would be (1-Alpha). I am just wondering if the p-value just differ based on the side we chose to test?
You explained it so well, it was really helpful ! :D
Great Video! Everything makes so much sense now! Much appreciated! :)
Thanks. I'm glad to be of help!
Perfectly explained and extremely helpful!
Thanks Daniel! I'm glad to be of help.
I don't use linear interpolation in this situation because it's not a linear function. I think it might be misleading for some students and in my opinion it's just not worth it. Cheers.
Hello I have this question...
when you're calculating the t value of a t distribution, under a null hypothesis for a 2 tailed test, would you always get a negative value of t (like in 4:14, the t=-1.31)? and why?
Great tutorial! But I was wondering how come you used df= n-1, while in class we are using df=n-2? When do you know which one to use?
same question here
When there are two samples, then n-2 is used.
When doing a TWO-sample hypothesis test with a t-distribution, having 2 sample sizes n1 and n2, the df = (n1 - 1) + (n2 - 1) = n1 + n2 - 2.
very helpful! thank u so much! gonna ace this test!!!
You're very welcome. Best of luck on your test!
Thanks! Professor handed us the table and never showed us what anything meant!
Beautiful explanation thank you. I understood every step of the way.
Awesome explanation
MAN YOU ARE MY HERO!!
+Alexis Liu Thanks!
Very good explanation by the way!
You saved my life. Thanks a million!!
+Paulo Henrique Carvalho You are welcome Paulo!
Great Tutorial man
Thanks!
jbstatistics
o.o
soooo, is this Z testing? due to the alternative?
THIS IS A FAB EXPLANATION THANK YOU
Very helpful! Thank you for your clarity.
I still don't get how you use software to find the P-value!
Me either!
You won't ever be asked for the P value on a written test. However you can be asked for the percentage interval it falls into.
No my professor asked for the P value on our written test, but depending on the problem you can use the JMP software to calculate it
halohellocj
You can find P value for Z distribution
you can't find P value for T and Chi distributions without Software.
raj patel however, you can find the interval for the p value "(ex. 2.5% - 5%)
can you do a video on finding the p-value for a two-sample t-test?
You are very welcome!
Great explanation! Thanks very much.
You are very welcome!
This may be a silly question but in 4:44 how did you know to look at the left tail and not the right tail? do you just look at the smaller tail? Very helpful video btw, thanks.
For the alternative hypothesis with > you look at the right tail ex. U(mean) > 2 = Right tail test
For the alternative hypothesis with < you look at the left tail ex. U(mean) < 2 = Left tail test.
For the alternative hypothesis with "does not equal" you look at both tails (Multiply P Value by 2)
ex. U (mean) =/ [does not equal] 2 = Two tail test
raj patel got it, thanks!
For t = -1.58 and t = -1.82, it means that the interval of P-value should be same but there is a different p-value in a book for t = -1.82 (for 7 degree of freedom) which is outside of the interval [0.1, 0.2]. Why?
Exellent explication!!! Thank you so much!!!
Thankz buddy :) You are a lifesaver (y)
Chameera Nissanka I'm glad to be of help!
best video.. made my problem solved ! thumbs Up
Thank you jbstatistics. You are such a life-saver.
this really helped but if i dont have the software then how do i get to a solution
this saved my life. thanks
Very nice presentation; but sir can we determine the exact p value in betwwen two p values and two t values using interpolation?
It's not a linear function, so you won't be able to determine the exact p-value that way. Some people do recommend approximating the p-value in such a fashion, but I don't. (I don't think it's worth it, and we typically use software to find the exact p-value.)
had to log in to thumb this up :)
Nice videos. Why don't you simply use the linear interpolation to find the p-value 0.021?
Thank u.
But one question
With df 8,p(-2.5
great teaching !
Thanks!
Can you do an example where the t-value is negative for the 3 scenarios (< , > , not equal to). Thank you.
hi, so can we find p value manually and not using any software?
why would you call a negative t-value any more absurd than a positive one?
I wouldn't.
How do you know which number to put 1st? .01 or 0.025 ?
You seem to have left out a description and implementation of alpha.
how do i find the p-value for T tests on minitab. I know how to do Z but with T I keep getting it wrong
This is a very nice explanation. Thank you Sir. :-)
+Muhammad Aiman You are very welcome!
how about negative t value sir? for example t = -2.14, how can we find the p-value with that?
There's a negative test statistic example in this video. I think of these things :)
@@jbstatistics Yes, I'm aware of that sir. But in the video we got negative t from the two-sided test, isn't it should be different for one-sided test?
i have one question. its one sample test. so there is one sample. DF = n - k - 1 . so wouldnt it be 8 and not 9?
No, it's a one sample t test and the degrees of freedom are n-1.
oh i got it wrong. thank you
Super helpful, thank you so much! :)
You are very welcome!
sorry, may I ask something? If my test statistics =24.5519 n =8... d.f 7
paying 1000 dollars for tuition and here I am skipping lectures to watch RUclips. GG
Very very useful
thank u so much!!
You are very welcome Ranjit!
Great video ☝👍👍👍
You made my day.
Thank you this is so helpful!!!
Do we need a significance level to find the p value?
No. The p-value is based on the data. We can then compare it to the significance level, if we have one in the given situation.
Why am i doing this for a zoology degree
thank you so much, it is very helpful
You are very welcome!
You're not using the t-table to find the p-value in this video. You still calculate it from software. Maybe you should rename this video to "Using the t-table to obtain a very rough estimate of the P-value in one-sample t-tests"
hey why do we need to double the area for the last example?
I discuss that in other hypothesis testing videos (e.g. ruclips.net/video/m6sGjWz2CPg/видео.html). This video is dedicated using the t table, and so I don't get into any of the concepts.
omg help guys, my tstat i found is -0.9318. I looked at the table and it's only positive values. how do i find the p-value from this and my d.f is 17. Help please =(((
how do you input the info to a calculator to get the p value??!! pls help
That would depend on the calculator, and typical calculators do not have the appropriate function. The tables exist because these values are found with software, and people do not always have access to appropriate software.
A calculator along the lines of a TI-83 would have a function to do it. A typical $10 calculator will not.
Hey, how can I get the exact P-VALUE of t test using students t distribution table? You didn't teach howw
I didn't teach how because it's impossible. If you want the actual p-value you need to use software. Some people use linear interpolation to approximate it, but I think that's a waste of time and misleading.
Why that null hypothesis not equal and geater than sign?
How to do it if I don't have software??
How can I find the t value for 63
very helpful. thanks
p value is similar to level of significance?
very nice man
it was very useful thank you
You are very welcome!
Thanks man! awesome
great vid... thanks!
very helpful!
You are very welcome!
Can you please transfer to Brock and replace the Russian guy sometime in the next few days?
? Please I want an answer to how to calculate the p value
As the title implies, this video is about using the t table to find the p-value in one-sample t tests. In many settings (t tests included), there isn't a formula that enables us to calculate the p-value without using software or a table.
This title is my proposal Construction of a parametric test of the ؟؟
estimator of the extreme value index under censored data Any Help ?