Excel 2013 Statistical Analysis #06: Frequency Distributions & Column Charts, Categorical Variables

HTML-код
- Опубликовано: 21 авг 2024
- Download files: people.highlin...
This video covers how to create Frequency Distributions and Appropriate Charts for Categorical Data using Formulas, PivotTables, Column Charts, Bar Charts and Pie Charts:
1. (00:32) Overview with diagram of tables and charts we will create in this video
2. (01:01) Notes in Workbook that you can print out and read
3. (02:05) Define Frequency Distribution
4. (03:55) Frequency Distribution create from Cell Phone Sales Data
5. (04:00) Advanced Filter to get a Unique List for Frequency Distribution
6. (05:55) Using COUNTIFS function to Create Frequency Distribution
7. (07:00) Formulas to create Relative Frequency
8. (09:36) TRUNC function to show that Number Formatting does NOT remove decimals
9. (11:00) Why Relative Frequencies add up to 1: Collectively Exhaustive and Mutually Exclusive Categories
10. (11:20) Formulas to create Percent Frequency with Number Formatting
11. (13:24) Formulas to create Percent Frequency with Times 100
12. (14:54) Add Borders using Format Cells Dialog Box: Solid Top Border and Double Bottom Border
13. (16:38) Use PivotTable to create Frequency Distribution
14. (17:38) Create Relative Frequency & Percent Frequency using the “Show Values As” feature and the “% of Column Total” option
15. (19:30) Compare and Contrast Formulas and PivotTables
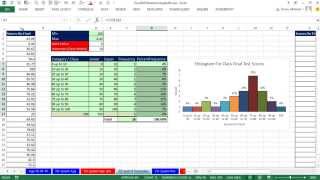
16. (21:09) Column Chart for Frequency Distribution with Categorical Data
17. (23:59) Column Chart for Percent Frequency Distribution with Categorical Data
18. (25:10) Bar Chart for Frequency Distribution with Categorical Data
19. (25:44) Pie Chart for Percent Frequency Distribution with Categorical Data
20. (27:30) Chart from PivotTable with Many Columns of Calculations (Trouble)
21. (28:57) Create Individual PivotTables and PivotCharts to solve “Trouble”. Frequency Distribution create from Boomerang Product Sales Data.
22. (31:11) Discrete Quantitative Data (Numbers) should be charted with a Column that has Gaps.
23. (31:55) Pareto Chart
Tabular & Graphical Displays For Categorical Variables


Excel 2013 Statistical Analysis #06: Frequency Distributions & Column Charts, Categorical Variables
Download files: people.highline.edu/mgirvin/excelisfun.htm
This video covers how to create Frequency Distributions and Appropriate Charts for Categorical Data using Formulas, PivotTables, Column Charts, Bar Charts and Pie Charts:
1. (00:32) Overview with diagram of tables and charts we will create in this video
2. (01:01) Notes in Workbook that you can print out and read
3. (02:05) Define Frequency Distribution
4. (03:55) Frequency Distribution create from Cell Phone Sales Data
5. (04:00) Advanced Filter to get a Unique List for Frequency Distribution
6. (05:55) Using COUNTIFS function to Create Frequency Distribution
7. (07:00) Formulas to create Relative Frequency
8. (09:36) TRUNC function to show that Number Formatting does NOT remove decimals
9. (11:00) Why Relative Frequencies add up to 1: Collectively Exhaustive and Mutually Exclusive Categories
10. (11:20) Formulas to create Percent Frequency with Number Formatting
11. (13:24) Formulas to create Percent Frequency with Times 100
12. (14:54) Add Borders using Format Cells Dialog Box: Solid Top Border and Double Bottom Border
13. (16:38) Use PivotTable to create Frequency Distribution
14. (17:38) Create Relative Frequency & Percent Frequency using the “Show Values As” feature and the “% of Column Total” option
15. (19:30) Compare and Contrast Formulas and PivotTables
16. (21:09) Column Chart for Frequency Distribution with Categorical Data
17. (23:59) Column Chart for Percent Frequency Distribution with Categorical Data
18. (25:10) Bar Chart for Frequency Distribution with Categorical Data
19. (25:44) Pie Chart for Percent Frequency Distribution with Categorical Data
20. (27:30) Chart from PivotTable with Many Columns of Calculations (Trouble)
21. (28:57) Create Individual PivotTables and PivotCharts to solve “Trouble”. Frequency Distribution create from Boomerang Product Sales Data.
22. (31:11) Discrete Quantitative Data (Numbers) should be charted with a Column that has Gaps.
23. (31:55) Pareto Chart
Tabular & Graphical Displays For Categorical Variables
He is an amazing person who dedicates himself to teaching. Everyone needs to appreciate him because I am studying at one of the most expensive private universities in Turkey. Yet, these videos increase my knowledge more than lectures that were taught by "leading" academic stuff(?????). I realized that these people were pocket thief who has no respect for their students and jobs. They are still tragically promoted as prominent scholars in their field. Furthermore, they always blame their students when they cannot teach their lectures. If I were charged from job recruits in the college, I would do anything in order to hire him(fired free-riders who steal time of students and sabotage their future ). Lastly, I wish he would be happy and continue to help other people who need supports in their learning life.
Top quality, extremely well explained concepts and excel techniques, entirely free! Thank you Mike!
You are welcome, Rodrigo!!!
Cool "Pareto chart" at the end of the video!
Thanks!
You are welcome!
great teachings, as always!
your video is the best.Gonna dig more of it...
Thanks again for another wonderful and informative video
You are welcome, Ahad!
Thnks, very good effort
How could I missed these videos when I was in college. I failed the exam because of this. So sad
Yes, Nguyen, I have full statistics classes here at RUclips. For you and other like us that want to learn and have fun : )
Thank you for this tutorial. Best regards
You are welcome!!!!! Thanks for your support, Gorjan, with your comment and thumbs up, and of course your Sub : )
Thanks!
You reference a book. Is it available for purchase or could recommend some books on Excel, statistics, business analysis? Thank you. Excellent videos.
How come all good teachers only exit in RUclips ???! I wish I had a teacher like you when I was in school.
Thanks
You are welcome, clifford : )
When I try to use the advance filter option on a previously created table, for some reason Excel will not let me specify the column of interest. I am not sure how to get around this dilemma. Any help would be much appreciated. Kind regards
I have a excel 2013 standard edition with me. i am not able to see the powerpivot add-ins. I have searched the internet and i see only powerpivot download is available only for excel2010. Where can i download the powerpivot for excel 2013 ?
You can't download for Excel 2013. Microsoft made it hard in 2013. You have to have Professional Plus, 365 Professional Plus or Excel Stand Alone. See this video:
ruclips.net/video/yjASjwJCIxA/видео.html
I have 2 ( one forecast and the other actual) rows of data about employe and their time writing. When I do a pivot and group it employee , the group total shows forecast+actuals which is not right. how do i overcome this.
Usually you have to have a proper data set with columns, not rows, one for actual and one for forecast. You might post your question to THE best Excel question site:
mrexcel.com/forum
Hi Mike. Love your videos, love your work!
I am a university graduate wanting to go into accounting and I just have one question. I have mastered your Excel 2007 Highline series and just wanted to know if that covers close to everything in Excel (if we ignore macros)? If not, what would you recommend me to learn next? Thank you!
My channel does not cover everything. For VBA try excelVBAisfun at RUclips.
How can i get the excel file for this video? Thank you in advance.
Hi Mr. Excel Fun:
I have a question how to calculate fill rate for each customer by month.
For Instance: Month 1, I have 4 customers send 20 orders to me
I have a difficulty to calculate the fill rate for each customer because some reason below
- Each customer has different order number, order date, ship date(expected ship date) and invoice date( the date I ship product and make the invoice ) and the ship date # invoice date.
- some orders I can ship 100%, 80%, and 0%
I believe that excel can solve this scenario and I think you the King of Excel
I hope you can help me!
Thanks Mr Excel Fun
BNA
I am not sure, try THE best Excel question site:
mrexcel.com/forum
ExcelIsFun and mr. excel, thank you for all your work.
Hi, how can I short the frequency values from high to low
You can do so by right-clicking in any cell of this column and choose from Sort "Sort Largest to Smallest"
question why use you speak cell in excel? :)
It helps a bad typer like me, sometimes, when I enter data.
@@excelisfun but you are the best teacher of excel I know :)
@@DIGITAL_COOKING Thank you, sir!!!!! One of the best, all for free = That is my way of trying to make the world a better place : )