How would you do this for a large data switch non uniform / random dates? I’m trying to show moving average of how open positions have been open since Jon posted date and the dates are all over. All videos like this start with uniform date delta
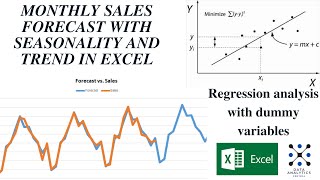
Hi Tyler. This kind of model assumes a sequential time series. It would not be useful for a random sample. You might try regression for random sampling.
If I have monthly totals for the last two years (24 observations) and want to forecast another two years, how do you adjust the formulas to accomplish this? I’d like to use a 3 month moving average. So where my dataset ends, how do I forecast where the observations end?
You really can't do it. Since these models are reliant on past observations, eventually your forecast becomes the last observed data point as you move out into the future.
Hi. It's the median absolute deviation, which I forgot to talk about. Just for comparison to the mean. In a "good" forecasting model they should be abolut equal.
How can you forecast the data in week 6/4/2018 and so on? Can we use the same method being use before this week and just use the forecasted data(125.45 in week 5/28/2018)?
Thanks for your question. With these models, if I am using 5 data points to forecast 1 period into the future, that's really all I can do. If I out one more period, then I will only have 4 actual data points to base the forecast at t+2 on. Going farther out into the future you could rely on the forecast value, but your error tends to increase.
It's hard for me to imagine a good application of this method for a single football player. Mainly because there are lots of explanatory variables to consider. So if you are looking to forecast something like rushing yards it will depend on things like the defense being played against, are they home or away, how many carries, etc.
How I can calculate equivalent EMA in different time frame? i.e. I would like to find stocks which their price is higher than 13 EMA on a weekly chart frame but my options are Daily Moving Averages like 20,50,100 and 200. So what daily EMA number would represent 13 weekly EMA? Can anyone help please?
@@MattMacarty thanks for the input but I am not sure if I understand. Do I have to go through the Excel spreadsheet to generate the result? Or you are saying if a stock's Alfa is around 0.14 then it's price should be at 13 weeks EMA?
Hi Matt, thanks for the great video. Do you mind to explain what is the difference between Mean Absolute Deviation (MAD) and Mean Absolute Error (MAE)? Because the formula that you are using for calculating MAD is similar with MAE.
Yes I might use something like the median of the surrounding values assuming there is no reason to believe the missing data is vastly different. You could also just fill forward the last known data point into the missing one.
It really depends on the data you are looking at, and stock prices are notoriously difficult to forecast. I chose these lookback periods arbitrarily just to compare two different forecasts using the same method.
@@Diego-ck9zl It is sort a trial and error approach. Over time you see which forecasts work the best. As a baseline though I would choose something that historically has lower errors. Forecasting is both Art and Science.
You can't use this model to reliably forecast more than one period since moving out farther drops actual observations. Eventually your forecast just becomes the last observation.
Thanks for your question. With these models, if I am using 5 data points to forecast 1 period into the future, that's really all I can do. If I out one more period, then I will only have 4 actual data points to base the forecast at t+2 on. Going farther out into the future you could rely on the forecast value, but your error tends to increase.
This kind of model will forecast out one period into the future. Most of the work is to fit the model and measure how well it can be expected to forecast.
@@samwoon1947 Assuming you can get all of the data in one file, you should be able to do this with a Macro in Excel. I would output the results to a second workbook. It would be pretty easy to do this in Python or other languages as well.
@@MattMacarty thanks and appreciate your reply. =) .but even with macro I will need to manually enter one part number at a time (since the formula is based on each PN). and that will also mean that many worksheets need to be created separately . and end of the day, manual entering of each PN is tedious and compile it into one worksheet after that is also tedious.


Very well done. Amazing explanation. Easy for everyone! Thanks
Glad it helped.
This was extremely helpful - Thank You!
Glad it was helpful!
Thanks buddy. You saved me
Glad it helped
nicely explained
Thanks. Glad it helped
How would you do this for a large data switch non uniform / random dates? I’m trying to show moving average of how open positions have been open since Jon posted date and the dates are all over. All videos like this start with uniform date delta
Hi Tyler. This kind of model assumes a sequential time series. It would not be useful for a random sample. You might try regression for random sampling.
If I have monthly totals for the last two years (24 observations) and want to forecast another two years, how do you adjust the formulas to accomplish this? I’d like to use a 3 month moving average. So where my dataset ends, how do I forecast where the observations end?
You really can't do it. Since these models are reliant on past observations, eventually your forecast becomes the last observed data point as you move out into the future.
TQ
Glad it helped
where does the 1.28 in cell H4 come from? (towards the end of the video, under 10 week forecast errors)
Hi. It's the median absolute deviation, which I forgot to talk about. Just for comparison to the mean. In a "good" forecasting model they should be abolut equal.
how we did not forecasting for 1/1/18, this there specific reason for it ?
Yes. If you forecast 1/1, you will incorporate look ahead bias. Your first 5-period MA forecast will occur at the 6th obsevation.
How can you forecast the data in week 6/4/2018 and so on? Can we use the same method being use before this week and just use the forecasted data(125.45 in week 5/28/2018)?
Thanks for your question. With these models, if I am using 5 data points to forecast 1 period into the future, that's really all I can do. If I out one more period, then I will only have 4 actual data points to base the forecast at t+2 on. Going farther out into the future you could rely on the forecast value, but your error tends to increase.
thank you for sharing. I played fantasy sports, can this moving average predict the next performance of player?
It's hard for me to imagine a good application of this method for a single football player. Mainly because there are lots of explanatory variables to consider. So if you are looking to forecast something like rushing yards it will depend on things like the defense being played against, are they home or away, how many carries, etc.
@@annadad2023 Let me think about this. It's really a different kind of model where we are optimizing some outcome. It will be pretty involved.
How I can calculate equivalent EMA in different time frame? i.e. I would like to find stocks which their price is higher than 13 EMA on a weekly chart frame but my options are Daily Moving Averages like 20,50,100 and 200. So what daily EMA number would represent 13 weekly EMA? Can anyone help please?
See this video: ruclips.net/video/IjETktmL4Kg/видео.html EMA 13 is effectively alpha = 0.14ish
@@MattMacarty thanks for the input but I am not sure if I understand. Do I have to go through the Excel spreadsheet to generate the result? Or you are saying if a stock's Alfa is around 0.14 then it's price should be at 13 weeks EMA?
Hi Matt, thanks for the great video. Do you mind to explain what is the difference between Mean Absolute Deviation (MAD) and Mean Absolute Error (MAE)? Because the formula that you are using for calculating MAD is similar with MAE.
Glad it helped. Just a different name for the same thing. MAD makes for a catchier acronym!
So where did u use the k+1 data?
That's the forecast
Nicely Explained. I have a question - How can we utilize MAD, MAPE to improve our model ?
You will would try several different MA periods, say 5, 10, etc. and look for the model that minimizes the error measurements
how do you deal with real-life scenarios? i.e., missing data? should we just use interpolation methods?
Yes I might use something like the median of the surrounding values assuming there is no reason to believe the missing data is vastly different. You could also just fill forward the last known data point into the missing one.
Thank you for the video. My question is how do we determine how many period to include? Why did you choose 5 or 10?
It really depends on the data you are looking at, and stock prices are notoriously difficult to forecast. I chose these lookback periods arbitrarily just to compare two different forecasts using the same method.
@@MattMacarty and if you were forecasting sales, how do you determine the periods to include? Don´t it have to be the one who minimize the errors?
@@Diego-ck9zl It is sort a trial and error approach. Over time you see which forecasts work the best. As a baseline though I would choose something that historically has lower errors. Forecasting is both Art and Science.
I need to do a forecast of staffing need. How do I do that?
@@lisaculp6864 how did u go?
hi
in this case how can we do for next 7 months forecasting
You can't use this model to reliably forecast more than one period since moving out farther drops actual observations. Eventually your forecast just becomes the last observation.
Is this simple, exponential or weighted MA?
This one is simple moving average. This one is weighted and Exponential: ruclips.net/video/IjETktmL4Kg/видео.html
how can you forecast the data after week 6/4/2018?
Thanks for your question. With these models, if I am using 5 data points to forecast 1 period into the future, that's really all I can do. If I out one more period, then I will only have 4 actual data points to base the forecast at t+2 on. Going farther out into the future you could rely on the forecast value, but your error tends to increase.
I can't understand 😕
Which part?
This is not a forecast. Where is the extrapolation with the data? You are just drawing the trend
This kind of model will forecast out one period into the future. Most of the work is to fit the model and measure how well it can be expected to forecast.
你算錯了
你是什么意思?
is there any fast way to forecast 1000 part numbers (inventory) at one go?
Do you mean to forecast each one based on its own history?
@@MattMacarty yes correct. each part number base on 3 years historical data to forecast.
@@samwoon1947 Assuming you can get all of the data in one file, you should be able to do this with a Macro in Excel. I would output the results to a second workbook. It would be pretty easy to do this in Python or other languages as well.
@@MattMacarty thanks and appreciate your reply. =)
.but even with macro I will need to manually enter one part number at a time (since the formula is based on each PN). and that will also mean that many worksheets need to be created separately . and end of the day, manual entering of each PN is tedious and compile it into one worksheet after that is also tedious.
@@samwoon1947 I think I would look at automating this with Python. It might be painful the first time, but after that a big time saver.