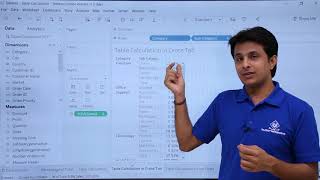
Table Calculations in Tableau: Everything You Need to Know

HTML-код
- Опубликовано: 7 авг 2024
- Table calculations in Tableau were my nemesis for 10 YEARS. Then one day it clicked. I wrote it down, turned it into a picture. In this video, I talk about how I understand them now and how I translate table calcs into an easy to understand sentence.
My blog post - www.vizwiz.com/2017/02/table-c...
Blog post from The Information Lab referenced in the video - www.theinformationlab.co.uk/2...  Хобби
Хобби


![Megan Thee Stallion - Mamushi (feat. Yuki Chiba) [2024 London Performance]](http://i.ytimg.com/vi/pxTCJUuorKc/mqdefault.jpg)

Dude, you are too good. It's amazing, I never understood table calculations before so easily. Thanks a lot.
There cannot be any more explanation required about this most powerful feature of Table Calculations. You made everything crystal clear.
This lesson has really helped me to understand concept of table calculations. Appreciate a thorough lesson on table calculation advance level as well.
This is my favorite of your videos, Andy!
Thank you for your honesty and for your clear guidance!
thank you! I ran into issues with table calcs but this video helped shine a lot of light on it!
Andy, thanks for the superb tutorial. This is a really great way to demystify tableau table calculations.
This really helped me to finish the table calculation part of workout Wednesday (EPL rankings) of this week in no time. LOD piece took a while but your other short videos on it evenrually helped me think through it. Thanks Andy!!
Extremely useful for my Tableau Professional Certification Exam preps!
That was a very detailed and clear explanation of tableau calculations!
This lesson really clears things up for me regarding table calculations. I will take this by heart. Thank you, Andy.
My pleasure. I’m glad you found it helpful.
Thank you so much. This video has cleared up my confusion regarding table calculation.
A big thank-you Andy, what a great way to consolidate this, very helpful!
Finally I found a right teacher to learn Tableau. thanks andy
Thank you ! This is the best table calculations tutorial! Subscribed 👍
Thank you so much for simplifying this Andy. It was very helpful.
Thank you, Andy for the detailed explanation. very insightful.
Ultimate Kriebel, Thank you So much for posting this video. It teaches how to read table calc
oh man... now I get table calcs so much easier. great way to explain this.
Great Job Andy.
Requesting you to post a dedicated video on some basic calculations tips also.
Keep on sharing Tableau Master.....
This is pure GOLD! Thank you Andy!!!!
Now that I’m building tableau reports, the for each statement is the best technique ever. It works for LOD’s as well.u showed that in another video. Thanks
Andy, as always, great content. I couldn't understand a thing from the blog that Tableau has published to explain this. Love this channel. Please never stop.
Glad it was helpful!
I wish I found your post earlier, Andy...it is the most helpful interpretation to decipher the code of the intimidating table calculation!
Very clear and helpful, really appreciate it!
Thanks, Andy! This is a timely help indeed :)
Loved it! Thank you, Andy.
Thats really great...it gave me lots of clarity on using LODs
Great information! Thanks for the clarity!
It's interesting to hear it explained like this, and then compare your logical sequence to the Tableau UI. There aren't many cases where the Tableau UI is off, but this looks like one where it needs another rethink.
Agreed Charlie. The whole UI needs to be flipped upside down and the words changed for it to make sense. But now that I understand it, please don't change it. :-)
Thank you so much Andy! This gives me a new approach when it comes to table cal
Happy to help!
Very clarifying. Makes me wonder why Coursera couldn't lay it out this clearly
Thanks for this Andy! Super helpful video!
Glad it was helpful!
Thank you Andy, great lesson!
Thanks for great video - perfect sir !
Very well explained, Thank you!!
Cool thanks Andy very consice and useful
really great! thanks a lot. i have tries to understand the table caluclation and i fail. now got it.
Hi Andy, I want to know how we connect different sheets of excel to different sheets in Tableau? Could you please help?
Thank you. This is very helpful.
Superb, thank you!
very nice explanation
Andy iam big big fan of u, thanku for giving details explanation about tableau
My pleasure. I’m happy to hear you find it useful.
very helpful! thank you so much!!!
I found this very helpful. Thank you 🙏
You're so welcome!
Thank you, Andy. Tableau should pay you for this!
Rayce Rollins wouldn’t that be nice!!
@@vizwiz :)
Thanks Andy!
I need to see this video again...
I learned a lot,thanks.
Awesome explanation! Easy to remember! By the way, pls charge your Mac :)
Thank you so much Andy!
My pleasure. I’m glad you found it helpful.
C'est top! Meric, Andy.
This is PURE GOLD, thanks Andy! If we add a secondary calculation, how we would read it?
Let's use a pareto that calculated the % of total running sales by product and we region in the rows. So essentially calculating a pareto per region. You would read it like:
"For each Region, calculate the running total of sales by Product then for each Region, calculate the % of total sales by Product."
Andy Kriebel Great video sorted out many confusions and hit and trial at my end 😂
Thank you for this!
Glad it was helpful!
Hi Andy Hope you are doing good i have been following your channel since long back. can you please make video for tableau server.
Can you also make us understand what is running total ?
Awesome!
11:03, should it be "by Quarter and Year" ?
Hi nice video.
I am new to Tableau. I am working on one assignment where I am trying to show relationship between source and destination IP addresses on dashboard. My requirement is to show respective destination IP of the source IP in the form of chart. Actually I am not getting what type of chart is good to show such relationships effectively. Currently I am using bubble chart to show my source IP address with size and when I click on particular SOURCE IP it displays respective destination IP address and its count in form of the table but I want to show in chart format. Could you please tell me how to do this. or Any similar example would be great. Thanks
Great video! What if I have say table 1 in Sheet 1 with two columns; number of orders for each customer and customer name and table 2 in Sheet 2 also with customer names but this time, the second column in sheet 2 has the number of times the customer ordered on Black Friday. My goal is to get in a new table in a new sheet ( say sheet 3) the ratio of orders on Black Friday/total number of orders per customer.. so basically the values in sheet 2/values in sheet 1. How do one go about achieving that? Bear in mind that not all customers will buy anything on Black Friday and I will wanna see them show up with a zero in sheet 3.
Note that, sheets 1 and 2 have some filters in the filter pane
Thank you!!
That was great! Could you make a similar video explaining Level Of Detail expressions?
Once I have the same level of understanding, yes.
I think we all have that barrier.
gre8 very detailed
You are awesome! I could not stand the girl narrating the official Tableau tutorials so I ended up here.
Neither could I! They REALLY need a different narrator. Or they need to alternate her with someone else.
I agree, I tried hard but just could not stand her voice
An interesting take would have been to show how the equivalent of table calculation could be done using LOD calculations.
Already done! ruclips.net/video/VlEwu-TKE_o/видео.html
Does it matters the order of unticking boxes in the red box?
Yes sometimes it does. Read them upside down. So if you have two boxes checked, let’s call them segment and category with segment at the bottom and you have region unchecked. And let’s say you’re using a difference from table calc. You would say something like “Calculate the difference from each region by segment then by category.” Once they are checked and you move them around, that order will stick no matter where you put the fields on the shelves. You could also think of the Region as a group by if you are familiar with Alteryx or SQL.
@@vizwiz is right if I try to imagine this particular case as a table where my rows are Regions and my columns are in the next order Segment->Category?
I gave you 2 likes, Andy, from both of my accounts
@ 7.18 easy to understand with power point
🏆