Dear Andy amazing video. You do standard 1 hour video in 15 minutes. Great Job. it took totally 3-4 hour for me to watch over and over and do by myself))). İt really helpful.
This video is awesome. I have a bad habit of seeing this and just wanting to code derived fields into my data source (excel sheet) and then refreshing the dataset in tableau. Cause 1)im a SQL developer 1st and 2)im lazy and hate learning things I might use once a year, if that. Your videos rock. Thank you for all this work. 😊
I really like these suggestions and you have some clean formulas for the PY and CY figures. Do you have any suggestions on similar formulas for MTD compared to PY and Previous Month? For example if you were looking at this month, you don't want to compare all of July 2022 to only 4 days worth of July in 2023, and at the same time, you don't want to compare all of June 2023 to only 4 days of July 2023.
Thank you Andy, I really appreciate it. What change can i make to the formula to return the last 12 month CY and PY.. eg Apr 2022 to Mar 2023. Instead of Jan to Dec as shown. Thank you for your help.
Andy, nice walk-through. Your current measures are fixed to the max year of your model's calendar. How do you get PY to be dynamic? In other words, if I add a year slicer, how do I get PY to change based on my slicer's selection?
Hi Andy another amazing learning video as always from you,Thank you so much!! Just want to know could please guide how can we create the YoY quarterly sales as well. Waiting for you reply🙂
These are really useful! Thanks Andy. Question - I'm trying to do the same thing with creating measures like CY and PY but instead using CY and Targets. However these are in different sources, on monthly level only and always create problems with trying to put it in the same chart to show any of the KPIs. Do you have any suggestions?
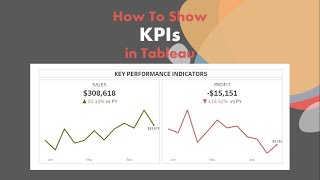
Hey Andy, thanks for the great tutorial! Can I ask how you maintain the same KPI numbers in sheets 2, 3, etc.? I duplicate the first sheet and try to insert the sparkline, but as soon as I drag the purchase date in columns and the CY Sales in rows, the KPI numbers are changed and they show "Sales from ... to ...", instead of 130,388,128 as shown in yours. I also tried to reapply them manually by editing the title, but I still get different numbers
I came across your video for the first time. I see that you are selling your Dataset so if we don't buy it, we can't follow your steps to create these KPI's. Correct?
how do i dynamically change colors for a KPI that's a single value like average rating? Like a card with a single value 4.5. Change color based on whether it's under 4 or above 4.
How to modify this Current Year Total to exclude months that are not complete in 2024? For PY I would like to compare only the months that are complete. Can you please guide?
Is it possible to swap the two measures based on two filters selection. There are two filters A and B, there are two measures sales and profit. If I select one value or more than 1 value in the A filter then it should take sales If I select one value or more than 1 value in B filter then it should take profit User Will select one value or multiple selection in the filter


Your teaching style is absolutely amazing! Thank You for these videos
You're very welcome!
@@vizwiz Thank you for sharing this.
Dear Andy amazing video. You do standard 1 hour video in 15 minutes. Great Job. it took totally 3-4 hour for me to watch over and over and do by myself))). İt really helpful.
Great to hear!
It's so handy to put the text in the title! I always forget I even have that option.
Saves you from creating an extra sheet :-)
You master the art of teaching.
watch for 5 minutes, hit like button. what i'm searching for. thank you Andy 😊👍
That’s great to hear. Thanks.
Concise and practical. Thanks a lot Andy
Very welcome
These are really useful Andy. Thanks for putting this out there!
Glad you like them!
Lulululu
This video was everything I needed. The explanation is so neat. Great job and thanks for the video👏🏼
Glad it was helpful!
This video is awesome. I have a bad habit of seeing this and just wanting to code derived fields into my data source (excel sheet) and then refreshing the dataset in tableau. Cause 1)im a SQL developer 1st and 2)im lazy and hate learning things I might use once a year, if that.
Your videos rock. Thank you for all this work. 😊
thanks for such great smooth explanation and in little time.
You are welcome!
thanks a lot Andy. this kind of bite-size content is mega useful for practical cases
Glad it was helpful!
I really like these suggestions and you have some clean formulas for the PY and CY figures. Do you have any suggestions on similar formulas for MTD compared to PY and Previous Month? For example if you were looking at this month, you don't want to compare all of July 2022 to only 4 days worth of July in 2023, and at the same time, you don't want to compare all of June 2023 to only 4 days of July 2023.
Watched till the end - incredible. Got to favorites video
Love this Andy!!!
Thanks for this useful video Andy!
My pleasure!
Thanks so much! These { } will now always be called a moo-stash-i-ohs :)
And you'll never forget what they are now either. :-)
Great no BS video. Thank you much.
You're welcome!
Extremely helpful. Thanks!
You're welcome!
Great video! im wondering whats the advantage of creating Calculated Fields over Quick Calculations and Sets?
Thank you Andy, I really appreciate it. What change can i make to the formula to return the last 12 month CY and PY.. eg Apr 2022 to Mar 2023. Instead of Jan to Dec as shown. Thank you for your help.
I have a similar question. what if you want to compare Fiscal years, from July 1 to June 30? Thanks for these videos, huge help!
You can do dateadd('month', -12, [Date field]) or replace month with year and do minus 1
This is super helpful. Thankyou!!!!! :)
You're so welcome!
Very usefull and good lessons. Thanks a lot
Andy, nice walk-through. Your current measures are fixed to the max year of your model's calendar. How do you get PY to be dynamic? In other words, if I add a year slicer, how do I get PY to change based on my slicer's selection?
Clear and precise! thank you
You're welcome!
Thank you! This is AWESOME!
You're very welcome!
Superb Video. Thank you.
Glad you liked it!
Hello Andy, I couldn't find the Dataset in xlsx or cvs to practice, where can I find it to download? thank you
As always, great video.
Just one question: Why "Sale Price"? Should is be "Total Sale"?
But, again, all very helpful.
Hi Andy another amazing learning video as always from you,Thank you so much!! Just want to know could please guide how can we create the YoY quarterly sales as well. Waiting for you reply🙂
hi Andy thanks for the video! i tried following your instruction but returned total instead of current year :( how can i fix this
These are really useful! Thanks Andy. Question - I'm trying to do the same thing with creating measures like CY and PY but instead using CY and Targets. However these are in different sources, on monthly level only and always create problems with trying to put it in the same chart to show any of the KPIs. Do you have any suggestions?
Hi, I love all your videos. Can you show how to create a guage chart in Tableau?
Thank you! I'm not likely to create a video for a gauge chart. There are lots of examples on Tableau Public.
Hey Andy, thanks for the great tutorial!
Can I ask how you maintain the same KPI numbers in sheets 2, 3, etc.? I duplicate the first sheet and try to insert the sparkline, but as soon as I drag the purchase date in columns and the CY Sales in rows, the KPI numbers are changed and they show "Sales from ... to ...", instead of 130,388,128 as shown in yours. I also tried to reapply them manually by editing the title, but I still get different numbers
Thank you Andy🔥🔥🔥
You bet
I came across your video for the first time. I see that you are selling your Dataset so if we don't buy it, we can't follow your steps to create these KPI's. Correct?
Can you create a dashboard tutorial that is focused on using parameters if you don't have already?
how to combine it with year parameter, so i can choose what year the sales i wanna see and how it compared to PY sales?
how do i dynamically change colors for a KPI that's a single value like average rating? Like a card with a single value 4.5. Change color based on whether it's under 4 or above 4.
Merci énormément
What is the difference between YOY % diff and YOY % diff total ?
Little bit lost… on thé why we have these calculated fields?
Thanks
The total will only return a single number.
How to modify this Current Year Total to exclude months that are not complete in 2024? For PY I would like to compare only the months that are complete. Can you please guide?
Is it possible to swap the two measures based on two filters selection.
There are two filters A and B, there are two measures sales and profit.
If I select one value or more than 1 value in the A filter then it should take sales
If I select one value or more than 1 value in B filter then it should take profit
User Will select one value or multiple selection in the filter
when I started building my spark line the CY Sales in my title displayed not as "100" but as "0 to 100". Not sure what I did wrong
You didn’t use an LOD.
Is the Data alone anywhere outside of a paywall?
Gotta pay my editor.
Please sir I tried it and they’re not working with the year parameter
Something is wrong with how you followed the steps. Carefully go back through them all.
Hey Andy, I can’t seem to find these examples on your tableau public?
Hidden until tomorrow.
Your Explanation is toooo Fast ...
can you make the video little bit slow...
Try pausing along the way. That's the best way to go through a tutorial. :-)
mustachio