Master Containers: Build an Interactive Tableau Dashboard From Scratch

HTML-код
- Опубликовано: 10 июн 2024
- In this video you will learn step-by-step how to create an interactive Tableau dashboard.
We'll start with a 2 datasets:
1. Beverage sales
2. Custom shape for US states
I will show you how relationships work in Tableau to combine these two datasets.
Once we create the data set, we'll build all of the charts we need, create a parameter, and apply the filters.
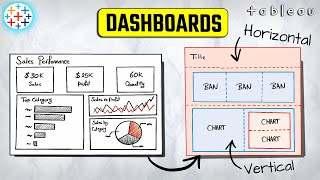
We’ll create:
1. Summary key figures (KPIs)
2. A custom map of the US
3. A monthly breakdown as a line chart
4. Two bar charts for products and customers
Lastly, we'll make the dashboard dynamic and interactive using different filter types and a parameter and make sure everything updates automatically.
As a bonus, you’ll learn a lot about working with containers in Tableau.
Data - data.world/vizwiz/sample-soda...
US Albers Map Projection - data.world/vizwiz/us-albers-e...
Workbook - www.vizwiz.com/2023/10/intera...  Наука
Наука


![Latto - Sunday Service (feat. Megan Thee Stallion & Flo Milli) [Remix] (Official Video)](http://i.ytimg.com/vi/9gL0F1xIt2I/mqdefault.jpg)

Understand the importance of containers..! Please make more videos on containers tips and tricks for professionals
This was amazing, as a student that's just starting out with tableau, this was a masterclass. It would have taken me hours to do this
Andy, you are a Tableau ninja! Super cool trainings.
Thank you. Completed! Every practice on parameters is appreciated!
Andy, just wanted to thank you for all the content you make. I'm doing a lot of progress in my work because of you. Always thank you. Cheers.
Keep it up
Really nice use of containers - thanks for sharing!
Thanks Andy learned something new today. I learned how to change the sheet name based on the filters.
Great video!. Thank you for sharing your experience through real examples.
Morning Andy, merci enormement.
Crazy how power bi just figured out the banding across the top this year 23 smh.. Great video, as always miss the dog in the videos 😊
Hi Andy. Great work. Your videos help me a lot. İm on the way to be master in Tableau with you.
Hi Andy, thank you for all you do. Please may i know what software do you use to make the arrow animations? They looking really good 👍
Great dashboard! 👋
I wonder why your videos receive relatively fewer views; nevertheless, the quality of your content is excellent.
Good question! 😂
Amazing video
Excellent.
from africa.Andy we get you
Amazing
Great insight Andy, This video came just when I needed information about choosing a metric.
I have a question though, is there a way to use the choose a metric option for the rows instead of the color shelf? Can you please help. Or is there another function I can use that would enable me to switch between two or more measures in the row shelf ?
Thank you
Perfect
Hello Andy,
I wanted to reach out and express my gratitude for your invaluable assistance in my Tableau journey. Your guidance has been instrumental since I began using Tableau a few months ago. I thoroughly enjoyed your latest video, as always.
I do have a quick question regarding the use of spatial files. I noticed that the maps created with spatial files appear distinct from the regular maps I've constructed. I'm curious about the advantages of incorporating a spatial file in map building and how it enhances the visualization experience. Your insights would be greatly appreciated
Hi Andy,I am having abit of a trouble here turning the py.file to a Csv file. Can you Help with that,please? I also tried using it on jupyter notebook. It ran but I haven't seen anything yet
What is the advantage of floating container instead of tiled container?
Check out the first video on my Tableau Containers playlist. ruclips.net/user/live63O98lnqezQ?feature=share