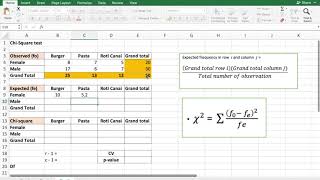
Chi Square Test for Customer's Satisfaction in Excel | Chi Square test for Likert scale in Excel

HTML-код
- Опубликовано: 21 авг 2024
- Customers satisfaction level and Chi Square Test
A step by step description of Chi Square Test for Categorical Variables using PIVOT Table has been given here with the help of a most searched example.
An example of excel file has been linked here. You can try the following link and give a comment on it.
docs.google.co...


Thank you very much for this wonderful tutorial! I learned so much.
You are most welcome.
Wow this is Informative, Sir ❤️
Thank you very much Anoop.
Really very nice 👏👏👏
Go ahead🙏🙏🙏🙏
Thank you so much.
Sir make some more on categorical data
Sure. Presently do you have any data?
Significantly different from which sir?
Very good query. Thanks a lot for the same. The investigator looks for the difference of satisfaction level of the customers and result shows the satisfaction levels of various customers are different which is written as significantly different.
Sir in this process, how can we predict that which category of customers is more likely to be strongly satisfied and which is likely to me strongly dissatisfied? What steps do we need to follow to get that?
And also please let me know, if it is fine by you, how can I connect to you as I want to discuss a few things about this analysis.
Very good question. For this purpose, see the frequency of the categories.
@@bapankalita4095 Yes Sir I did but this will show me old result. How do I make a prediction for new customers. I wanted to discuss that , please let me know if you can connect with me over a phone call or Email Gmeet.
@@utkarshsinghchauhan4892 Please read different types of regression for prediction.
Sir what if i have zero values should I still included the row and column with zero values?
Yes
Sir, in this situation, likert scale item considered as categorical variable right?
Thanks for your question. Can you please explain the question more clearly?
Yes Hiru, its categorical variable
Thank you Sir for your video. I just want to ask you i have generated data for tourist satisfaction in 13 categories. I want to apply different statistical methods on it. Can I you chi square, S.D. , variance on it?please suggest me.
You can go for Chi-square. No need to find SD or Variance,
@@bapankalita4095 Thank you sir for your reply. I will use chi square. Also, I am planning to add ANOVA. Is it ok to add both 2 test for one same data, and interpret the results?
@@snehalpatil6643 Why ANOVA?
Hello Sir, thank you for the video and valuable lesson. I am doing a research on customer satisfaction on online ticket booking system and have used 5 point likert scales to capture customer preference. Could you please suggest if chi square test would be better to proof that the customer satisfaction data collected via surveys are not va chance and has statistical preference? if possible, any way I can contact you :)
Thanks for your query. Your "surveys are not va chance and has statistical preference" is clear. Please make it clear.
@@bapankalita4095 Could you please suggest if chi-square test would be better to prove that the customer satisfaction data collected via surveys are not by chance and has a statistical preference? if possible, anyway I can contact you :)
@@AkashDas-qr7rj Since data are collected by preference, so any statistical test is not appropriate.
do u have the data sir? can u share the data to me? i want to practice this tutorial by myself. btw thx for the tutorial ☺
An example of such a file is given in the description. Please try it.
@@bapankalita4095 ok thank u sir
WWWWW
Thank you.
Dear sir can you share this Excel template
Dear Sir, I forgot to save.