thank you. I have watched more than 50 videos but the way you explained is very beginner friendly. It has made me clear rather than confusing like the previous 50s.
OMG Thank you! I have been trying to use pivot tables and a bunch of different methods and finally I came upon your video and was able to create a graph and analyze my data! I thought I was going to pull my hair out but your video saved me!
I would like to thank you for this. It is excellent. I had learned this a long time ago but had largely forgotten it. As I watched your presentation it all clicked back into place!
That was great! I did not create individual charts and ended up making one 100% stacked histogram. But the video helped me organize the dataset and was very useful in doing the initial steps of count and % before making the charts.
sir what about the numbers that are linked with attributes such as strongly agree=5, agree=4 and so on. How to analyze data that way? How to show overall positive and negative attitude?
I recommend using SPSS. In this case, your measures of central tendency should be the mode and median. Avoid using the mean and standard deviation, as Likert data is categorized as categorical rather than continuous. Using mean and SD is more sensitive for those categorical data.
Sir i need to know can we apply chi square test for this set of data... Plz let me help with this.. I have same set of data... But i m struggling with what type of statistical test can be applied to this data
Thanks for video, if i want to know how the question no 2 responses related to question no 5, means any relation or dependence one question to another" how I can do? Kindly clarify
@@nabeelakhtarr sir, I want to know one question reposne have any relation or dependence on another question responses...how i ll calculate in excel ? What kind of test ll be best ?
@@nabeelakhtarr .. sir we give code to strongly agree as 5 and agree as 4 neutral as 3 and so on instead of writing strongly agree, disagree, strongly disagree etc ?? How can we analyse that ?
@@nabeelakhtarr sir I have to analyze my likert scale data.... I m little confused in it. Can I have your Whatsapp no. there I can explain it in a better way....
Hello everyone i need to ask i am using a likert scale but as can i see in Likert-type scale no scoring so any one know how to measure data after gather ? No scoring in scale.


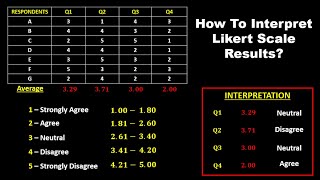


How to analyze Likert Scale questions and create graphs using Excel
thank you. I have watched more than 50 videos but the way you explained is very beginner friendly. It has made me clear rather than confusing like the previous 50s.
That’s good to know. I tried to make it as simple as I could. Do consider subscribing. Thank you!
OMG Thank you! I have been trying to use pivot tables and a bunch of different methods and finally I came upon your video and was able to create a graph and analyze my data! I thought I was going to pull my hair out but your video saved me!
I’m glad this helped! Thanks for watching and commenting.
I would like to thank you for this. It is excellent. I had learned this a long time ago but had largely forgotten it. As I watched your presentation it all clicked back into place!
Glad it was helpful!
Thank you very much for the explanation. It's of great help.
I’m glad it helped!
Thank you so much brother... You've saved the day... Jazak Allah Hu kahairan kaseeran
JazakAllah khair!
This was AMAZING, thank you so much! VERY helpful!
I’m glad this helped!
Really superb explanation...
Thanks for the encouraging words. Hope the video was helpful.
An excellent presentation. You're a great instructor!
Thanks a lot!
That was great! I did not create individual charts and ended up making one 100% stacked histogram. But the video helped me organize the dataset and was very useful in doing the initial steps of count and % before making the charts.
I’m glad this helped!
Sir, I m very grateful to you 🙏.
Most welcome 🤗
Thank you so much. I can now do my task better.
I’m glad this helped!
Salam. I just needed this video so baaaaaaaad!! Cant thank you enough! youre an angel 😙
@@nabeelakhtarr Can you please make a video on RACI Charts? I am doing my PhD and I want to create a RACI Chart as well. Please Help :)
THANK YOU FOR THIS VIDEO.
Learned a lot from your teachings thank you for the goodwork
Glad to hear it! Let me know what other lessons you would like. I have recently uploaded an MS-Word lesson on ‘how to handle long documents’
Informative and easy to follow!
Glad it helped! Please subscribe. Thanks!
sir what about the numbers that are linked with attributes such as strongly agree=5, agree=4 and so on. How to analyze data that way? How to show overall positive and negative attitude?
I recommend using SPSS. In this case, your measures of central tendency should be the mode and median. Avoid using the mean and standard deviation, as Likert data is categorized as categorical rather than continuous. Using mean and SD is more sensitive for those categorical data.
Simple and straight
Thank you! Please subscribe!
Well explained sir😊
Keep watching
This was VERY Helpful. Thank you so much!
Thanku very much 🙏
Hi, thank you for the video. how I can mix this Likert scale with the pivot table? To analyze the results by gender or education?
This was so helpful thank you
Sir i need to know can we apply chi square test for this set of data... Plz let me help with this.. I have same set of data... But i m struggling with what type of statistical test can be applied to this data
Hello, thank you that was very helpful
Welcome! 🙂
Sir, Please i have a questionnaire but the answers for the questions are different for each question. How can i analyze them??
Excellent! Thx!
hello, how did you highlight two different columns in making a chart? thank you!
Hello sir when I am trying to apply this method my number show 0
Check the decimal setting for your cell
sir how it is use in power query
That is the next video I will be creating 🤓
Khalid, I just uploaded the video you requested. Please have a look:
ruclips.net/video/9xX15PQxs00/видео.html
Thanks for video, if i want to know how the question no 2 responses related to question no 5, means any relation or dependence one question to another" how I can do? Kindly clarify
@@nabeelakhtarr sir, I want to know one question reposne have any relation or dependence on another question responses...how i ll calculate in excel ? What kind of test ll be best ?
@@nabeelakhtarr thank you sir for ur kind +ve response ...
Can we use likert scale without any hypothesis in the study ?
@@nabeelakhtarr How can I interpret the results...any video on that Sir.
Thank you!
Sir what when u have put codes like strongly agree=5 agree=4 neutral=3 disagree=2 strongly disagree=1
Sorry but I didn’t understand your question.
@@nabeelakhtarr .. sir we give code to strongly agree as 5 and agree as 4 neutral as 3 and so on instead of writing strongly agree, disagree, strongly disagree etc ?? How can we analyse that ?
Thank you so much!
Good job you can do more
Thank you
How can I fix this ?
Have a look at this video: support.microsoft.com/en-us/office/display-or-hide-zero-values-3ec7a433-46b8-4516-8085-a00e9e476b03
Nice Explanation....I need a little help from you
@@nabeelakhtarr sir I have to analyze my likert scale data.... I m little confused in it. Can I have your Whatsapp no. there I can explain it in a better way....
@Nabeel Akhthar Bhaiya...is there any app where I can reach out to you?
Hello Sir! I need your help as I am confused with my statistical tool with likert scale data. Can I contact you?
what kind of analysis method is this?
is this non-parametric?
Why not use a pivot table to get the totals for each response? Would have saved you alot if time!
I have done that here: ruclips.net/video/9xX15PQxs00/видео.htmlsi=3JgkxERzbqWzaOZj
Im student, whats mean blanks?
Tell me the time marker in the video.
Sir, please how to label as % for each question?
Hello everyone i need to ask i am using a likert scale but as can i see in Likert-type scale no scoring so any one know how to measure data after gather ? No scoring in scale.
what is the blanks?
Sir can you teach how to find regression line of this data
When I copy to other cells. the formula change
This is EXACTLY what I have been looking for. OMG, I could kiss you! 💋
Oh great! I hope it helped. Pls consider subscribing. Thanks!