Likert scale survey data analysis and interpretation on Excel and SPSS

HTML-код
- Опубликовано: 29 мар 2024
- Questionnaire items
Operationalization
Codes and labels
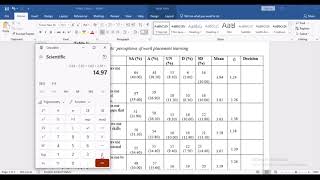
Descriptive statistics
Mean, standard deviation, min, max, and range
Frequencies and percentages
Cronbach alpha reliability
Exploratory factor analysis
Outlier removal
Sociodemographic variables in one table
Custom table function
Z score data transformation
Correlation
Regression
ANOVA
Chart and diagrams
Maslach burnout scale of exhaustion, cynicism and reduced efficacy
Self determination theory
Motivation and its types
Internal motivation
External motivation
Amotivation
The role of motivation on academic burnout
Millennials
Generation Z
Generation Alpha
Data interpretation and report in APA
✨Social media:
Mohamed Benhima, PhD
Email: datanalysis93@gmail.com
WhatsApp: +212619398603 / wa.link/l6jvny
#questionnaire  Хобби
Хобби


It feels great to find your videos.
Nice presentation. Sir, what is Zscore? How can I conduct convergent and discriminant validity?
If I do ANOVA after calculating the MEAN (which will form my continuous dependent variable) of all 6 items ( MOT 1, MOT 2, MOT 3, MOT 4, MOT 5, MOT 6), then how can i find out difference between my three groups (independent categorical variable), on the basis of any specific motivation item out of these: ( MOT 1, MOT 2, MOT 3, MOT 4, MOT 5, MOT 6) ?
Sir, please suggest the right way to do it. I know ANOVA can give me significant difference between the three groups with post hoc analysis, but how can I ascertain the difference on a specific item level, if I am transforming the 6items to a mean value? Is it better to do MANOVA or apply any other technique for this purpose??
You need to test Cronbach alpha reliability. Based on that, you can group the items and run ANOVA or Kruskal Walis H Test depending on the normality and homogeneity of the variance as well.
sir please how can I conduct Z test and report it in APA style
Z scores can be run on descriptive statistics. New variables will be created.