Calculating Power and the Probability of a Type II Error (A One-Tailed Example)
US
Войти
Calculating Power and the Probability of a Type II Error (A Two-Tailed Example)
13:40
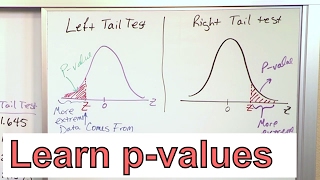
Calculate the P-Value in Statistics - Formula to Find the P-Value in Hypothesis Testing
22:42
HYPOTHESIS TESTING BASICS: Type 1/Type 2 errors | Statistical power
15:27
Sounds From The Sideline: #DALvsWAS | Dallas Cowboys 2024
07:45
Season 2025 Breakdown | Welcome To Noxus
09:10
Australia v India 2024-25 | First Test | Day Four
08:03
Calculating Power and the Probability of a Type II Error (A One-Tailed Example)
jbstatistics
Подписаться
212 тыс.
Скачать
Готовим ссылку...
Просмотров 657 тыс.
0
0
Добавить в
Мой плейлист
Посмотреть позже
Поделиться
Поделиться
HTML-код
Размер видео:
1280 X 720
853 X 480
640 X 360
Показать панель управления
Автовоспроизведение
Автоповтор
Опубликовано: 27 ноя 2024
Комментарии • 321
Следующие
Автовоспроизведение
13:40
Calculating Power and the Probability of a Type II Error (A Two-Tailed Example)
jbstatistics
Просмотров 289 тыс.
22:42
Calculate the P-Value in Statistics - Formula to Find the P-Value in Hypothesis Testing
Math and Science
Просмотров 1,7 млн
15:27
HYPOTHESIS TESTING BASICS: Type 1/Type 2 errors | Statistical power
zedstatistics
Просмотров 142 тыс.
07:45
Sounds From The Sideline: #DALvsWAS | Dallas Cowboys 2024
Dallas Cowboys
Просмотров 55 тыс.
09:10
Season 2025 Breakdown | Welcome To Noxus
SkinSpotlights
Просмотров 681 тыс.
08:03
Australia v India 2024-25 | First Test | Day Four
cricket.com.au
Просмотров 11 млн
40:21
Grandma is secretly a serial killer and cannibal?? The shocking crimes of the Granny Ripper
Bailey Sarian
Просмотров 665 тыс.
16:45
Power Analysis, Clearly Explained!!!
StatQuest with Josh Starmer
Просмотров 323 тыс.
17:48
P-Value Method For Hypothesis Testing
The Organic Chemistry Tutor
Просмотров 1,7 млн
15:29
Super Easy Tutorial on the Probability of a Type 2 Error! - Statistics Help
Dave Your Tutor
Просмотров 86 тыс.
8:11
Type I Errors, Type II Errors, and the Power of the Test
jbstatistics
Просмотров 401 тыс.
23:39
Statistics 101: Calculating Type II Error, Concept with Example
Brandon Foltz
Просмотров 90 тыс.
8:19
Statistical Power, Clearly Explained!!!
StatQuest with Josh Starmer
Просмотров 306 тыс.
21:14
The medical test paradox, and redesigning Bayes' rule
3Blue1Brown
Просмотров 1,2 млн
10:34
Type 1 (Alpha) vs. Type 2 (Beta) Error
Dirty Medicine
Просмотров 97 тыс.
9:45
Introduction to power in significance tests | AP Statistics | Khan Academy
Khan Academy
Просмотров 183 тыс.
28:49
НУБ И ПРО ПРОВЕРЯЮТ СЕКРЕТНЫЕ БАГИ МАЙНКРАФТ ! НУБИК И ТРОЛЛИНГ ЛОВУШКА В MINECRAFT
DakPlay
Просмотров 429 тыс.
53:26
ОНА ЗАПОМНИТ ЭТО НАВСЕГДА! Судьба самой убитой тачки из контейнеров!?
СЛОВО ПАЦАНА
Просмотров 506 тыс.
1:07:05
TESLA CYBERTRUCK НА ПОЛИГОНЕ. Что может пойти не так?
Асафьев Стас
Просмотров 410 тыс.
22:51
Выживаю в КИТАЕ на 1$ ! День 1
A4
Просмотров 1,1 млн
00:31
Социальный скальпель Плохих Песен🌎🌎 #shorts #slowslowcow #плохиепесни
slow slow cow
Просмотров 38 тыс.
00:25
Шотландский журналист Крейг Мюррей опроверг израильскую пропаганду
TRT на русском
Просмотров 381 тыс.
00:19
Китайка и Челлендж Змейка😂😆
KITAYKA
Просмотров 212 тыс.
00:50
☝️☝️☝️МАЛЫШ-СИЛАЧ 14 лет притворился НОВИЧКОМ | Школьник сделал то, чего не смог качок
Nikita Zdradovskiy
Просмотров 234 тыс.