Maam that equation at the very beginning gave me a mini heart attack but the video is really helpful maam because we are at the middle of collecting data thank youu somuchh maam for your effort
This video of yours, ma'am, has helped a lot. At first, I was clueless on how I would perform data analysis in my paper, but with your lecture, I am now optimistic about performing my data analysis, plus the research design from your example isn't far from mine, which makes it even more helpful. God Bless
I am having a hard time analyzing and compute our data ma'am but your video helps me to understand everything. Thank you ma'am, I can now start our Chapter 4 in research. Kudos to you ma'am. More power and thank you po. ❤
I have known the kinds of charts in every level of measurement and by this video I can now encode our data easily and knowing the purpose of every action in the excel
It's a very amazing video, well, I'm much more amaze at myself seeing how my dumb self was actually able to comprehend the task and follow closely with the instructions
Hi Maam! I've been struggling to compute the significant relationship of my variables in my thesis paper, but with your presentation and explainations, i already got it!. Thankyou mam! I didn't skip ads because you deserve it hahaha. More power mam.
Welcome! But those ads actually goes directly to the YT owner since my channel has not reached its 1k subscriber requirement for YT monetization. :) For now, this is a free service.
Thank you Maam for this video! I have known now how to encode and analyze data. It may come with difficulty but this information will help me fill the gap of my knowledge.
This video greatly helped me Ma’am. May i ask if you can also do a video about analysis, interpretation, and presentation of qualitative data. Thank you Ma’am!!! 🙏🏻
Do you have your video in data encoding for ANOVA analysis? That would be a great help for us as a student researchers. Thank you po, Ma'am. You explained well and it makes us get it easier.
Hello ma'am, if I am to find out if whether there is a significant relationship or not between the independent and dependent variable. What statistical tool is the best ma'am? Thank you ma'am. :)
Depending on the variables. If you need to find significant relationship among multiple variables, use multiple regression. But sig relation. between two, you can use correl.
Is ok if you could provide your data file so I can practice your data. I studying to for job tests and interviews but I need data for exercises. Thank you.
May I know if how did you get the weighted mean in Female and Male I am currently working on our research today and I am so confused🥶. Thank you if ever you will noticed this one its a big help
Ma'am Dorina can i ask, what does it mean in the table of the research paper F and M stands for?? and how to get their weighted mean?? thank you hopefully you noticed this.❤❤
Hi there! We just have to get the sum so we can apply the data analysis tool pack. Once you clicked the descriptive statistics in the data analysis tool pack, you can get the Average or the mean. The average or the mean is what you need in discussing and analysing your research data.


Maam that equation at the very beginning gave me a mini heart attack but the video is really helpful maam because we are at the middle of collecting data thank youu somuchh maam for your effort
Awesome an inclusive way of teaching Data Encoding and Data Analysis...~~~
Thank you for the step-by-step explanation ma'am, all of your contents are very helpful. God bless po.
Thank you for the information about the basic data encoding and data analysis
Thank you Maam for the lesson slowl but surely I'm learning how to apply the things you taught in Microsoft Excel
This video of yours, ma'am, has helped a lot. At first, I was clueless on how I would perform data analysis in my paper, but with your lecture, I am now optimistic about performing my data analysis, plus the research design from your example isn't far from mine, which makes it even more helpful. God Bless
Thank you Ma'am this would really great help to our research. God bless❤
I am having a hard time analyzing and compute our data ma'am but your video helps me to understand everything. Thank you ma'am, I can now start our Chapter 4 in research. Kudos to you ma'am. More power and thank you po. ❤
Great video maam! This would be a great help for us in data analysis. Thank you po.
Nice presentation. Thank You!
Hi,
Amazing explanation of data entry! The sound, tone, pinch, rhythm and so on is up to the mark.
I have known the kinds of charts in every level of measurement and by this video I can now encode our data easily and knowing the purpose of every action in the excel
This video was useful for me. Thank you!!
It's a very amazing video, well, I'm much more amaze at myself seeing how my dumb self was actually able to comprehend the task and follow closely with the instructions
Hi Maam! I've been struggling to compute the significant relationship of my variables in my thesis paper, but with your presentation and explainations, i already got it!. Thankyou mam! I didn't skip ads because you deserve it hahaha. More power mam.
Welcome! But those ads actually goes directly to the YT owner since my channel has not reached its 1k subscriber requirement for YT monetization. :) For now, this is a free service.
Thank you mam for sharing this video!
Omg! This video is just what I needed to finish the analyses of my quantitative data for my college thesis paper! Thank you soo much!
Thank you now i can start my chapter 4 part
MAM, I love you for this content it helps me a lot
Thank you Maam!
Thank you Maam for this video! I have known now how to encode and analyze data. It may come with difficulty but this information will help me fill the gap of my knowledge.
This video greatly helped me Ma’am. May i ask if you can also do a video about analysis, interpretation, and presentation of qualitative data. Thank you Ma’am!!! 🙏🏻
Sorry for the late notice. 'll probably make one in the future.
This is very informative and clear. Gonna share this to my friends and classmates.
thank you! looking forward to your research success!
@@dorinamae277 thanks!❣
Hi, can I ask on how to get the F and M on the data presentation? Thank you!.
THANK YOU PO SO MUCH!!!!!!!!
Hi Maam your video is very helpful. I would like to ask what is the appropriate test for sig. difference for occupation and level of knowledge?
Do you have your video in data encoding for ANOVA analysis? That would be a great help for us as a student researchers. Thank you po, Ma'am. You explained well and it makes us get it easier.
Ow, I'm sorry, I don't have it yet. Probably I can make one in the future.
Hello Ma'am! May I ask how will I code a part wherein 3 answers were selected? Do I put 1, 2, 3 on the codes? I hope this gets answered. Thank you!
Good Evening ma'am ... do you have videos about regression?
it's toooooo fAAAAAASSST
Hello ma'am, if I am to find out if whether there is a significant relationship or not between the independent and dependent variable. What statistical tool is the best ma'am? Thank you ma'am. :)
Depending on the variables. If you need to find significant relationship among multiple variables, use multiple regression. But sig relation. between two, you can use correl.
can we get the excel files as well so that we can practice using the data set that you have collected
Sure.
Thank you very much! You saved me from the extreme stress of nursing research! 🤍🌻
Is ok if you could provide your data file so I can practice your data. I studying to for job tests and interviews but I need data for exercises. Thank you.
Hi maam can you make a video on how to encode yes or no and checklist coz that's my survey
May I know if how did you get the weighted mean in Female and Male I am currently working on our research today and I am so confused🥶. Thank you if ever you will noticed this one its a big help
You probably needed to separate female data from male data and then find out their weighted mean separately.
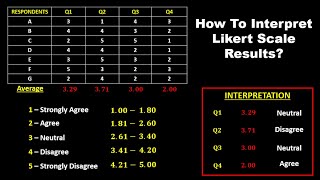
THIS VIDEO IS REALLY A HELPFUL ONE. HOWEVER, I HAVE SOME QUESTIONS MA'AM. DIS YOU CODED THE LIKERT SCALE AS 1 2 3 AND 4??
Yes, but you can also use 5 point likert scale.
To determine the scale range, you can use this formula: 5-1=4/5=?-0.01
God bless. ♥
Oh so ur supposed to get the sums and not the average? Thank you!!!
how to encode the responses faster po? do i have to check the survey answers 1 by 1 and encode it 1 by 1 also?
you need to encode it one by one unless it is a survey from a google form.
Ma'am Dorina can i ask, what does it mean in the table of the research paper F and M stands for?? and how to get their weighted mean?? thank you hopefully you noticed this.❤❤
up
I have 90 samples do i need SPSS or can i just use this method because i cant open spss
You can use either of the two.
@@dorinamae277Thank you!
Can i also ask one question? Which t test do i select for finding the difference level between male and female in emotional intelligence?
The video has skipped the part where i dont understand. How did you come up with the data in part a and part b?
You collect the data from your survey. Then find the total sum per item on each respondent.
How about with 3 variables maam?
6:15
I have a question po about getting the sum of the survey. Is it the sum that we have to get or the average? thank you po
Hi there! We just have to get the sum so we can apply the data analysis tool pack. Once you clicked the descriptive statistics in the data analysis tool pack, you can get the Average or the mean. The average or the mean is what you need in discussing and analysing your research data.
Tried so hard to not fall for the teacher.
Tried harder? Hehe. Thanks for watching my video.