Create a Pivot Table on your Mac Excel (Easy Tutorial and Step by Step Guide for Beginners)

HTML-код
- Опубликовано: 24 июл 2024
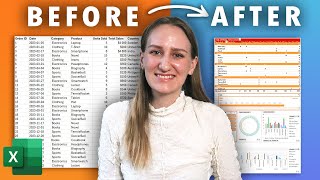
- Have you ever created a Pivot Table on your Mac Excel from scratch? Or ever wondered what kind of insight you can gather from one? Follow along as I take a case study of invoices, provide a step by step guide on how to create a Pivot, and analyze sales data to gather insight.
Want more? Check out the next series of advanced tips and tricks of the Pivot:
• Pivot Tables on Mac
#excel #excelonmac #pivottable #invoice #sales #analytics #mac #learnexcel #exceltutorial #excelforbeginners
Track: Infinity, by Declan DP - • Infinity - Declan DP |...  Хобби
Хобби


You save my life!!!! I am so thankful about the instruction.
Such a great help. Thankyou!
Thank you so much. This was very helpful!
Very clear and intuitive expanation, thank you Jess
Thank you very much for the kind words, Maneesh.
You save my life. Thanks a lot. Paying for this course will make me have a hole in my bank. Love the simple explanation. Thank you once again
I'm glad to hear that, Persona218149. Thank you!
Thank you! I was really lost on filters but this helped a lot.
I'm glad to hear that, thank you for the kind words.
Great explanation, thank you!
You are welcome!
This was the most simplest way of explaining. Thanks a lot. Can you provide links to some easy exercises that I can practice with answers?
Hello, and thank you for the comment! I am still developing the material, but please let me know if there are specific areas you'd be interested in.
can you explain what is trendline, what is a primary and secondary axis are, how I create a pivot table showing the negative data and positive data and how to filter those
* A trendline is a best fitted line to show general direction of your data points. * Primary and secondary axes are used when you have two different data sets you want to show at the same time, that have completely different units. For example, if you want to show number of customers as a bar chart (as primary y-axis and $ of revenue as a line (secondary y-axis). *To filter your pivot for values, right click on either the row label or column label -> Filter -> Value Filters -> choose "is less than" or "is less than or equal to" for example and enter the number like less than 0.
Do we have a shortcut to open pivot on mac
hey nice video. but how to add measure to the pivot table.. like to add the data to the data model while we create the pivot table... i cant find it on mac.. but on windows its a tick box is there while creating a pivot table...
could you help?
Hi Luv, thanks for watching! I assume "tick box" means the "PivotTable Fields" on the right hand side of your screen that shows all the different column headers for you to customize pivot table. When you first "insert a pivot table -> new worksheet" from the raw data, this "PivotTable Fields" shows up automatically as your cursor is automatically placed on cell A3 (in the pivot table). So if you accidentally clicked on a different cell outside the pivot table, click on any cell in cells A3-C20), and the "PivotTable Fields" will show up again. IF you received a pivot table from someone that you want to re-customize but don't see the "Pivot Table Fields" to do so, right click anywhere on the pivot table, and click on "Show Field List."
how do i organize the month?
I tried the Fn + Alt + F1. so the chart appears, how do I know if, let's say your example in the video is the best suited for which chart type?
There are many charts depending on your need. Check out my tutorial "Create Amazing Excel Graphs" to get an idea: ruclips.net/video/h4qlaHd0Dpc/видео.html
Hi Jess - is there a keyboard shortcut to pull up pivot tables on a Mac? The windows shortcut doesn’t work on a Mac.
Hi Judy, unfortunately there is no shortcut to create a pivot table on Mac. There are ways to create a pivot chart though. On the same sheet: Fn + Alt + F1. On a new sheet: Fn + F11.