How to analyze and visualize Likert scale

HTML-код
- Опубликовано: 15 авг 2022
- 📌 For assistance with data analysis, kindly contact me via this email: datanalysis93@gmail.com or WhatsApp: +212619398603 / wa.link/l6jvny / t.me/DrBenhima
Facebook: / benhima1
For support: www.buymeacoffee.com/Research101
Instagram: / medbenhima2015
TikTok: www.tiktok.com/@mohamedbenhim...
LinkedIn: / mohamed-benhima-phd-6a...
Google Scholar: scholar.google.com/citations?...
Twitter: / mohamed_benhima
WhatsApp: +212619398603 / wa.link/l6jvny
Telegram: t.me/DrBenhima
E-mail: Datanalysis93@gmail.com
RUclips CHANNEL: / @mohamedbenhimaphd
#likertscale #charts #graphs  Хобби
Хобби


![NoCap - Yacht Party [Official Music Video]](http://i.ytimg.com/vi/rm_lvDln8kE/mqdefault.jpg)

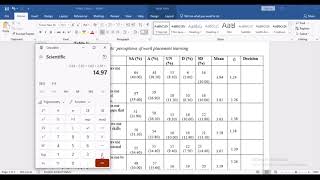
Stacked bar graphs are better used to visualize Likert scale items compared to bar graphs, pie charts or line graphs. Data labels and colours can be edited on Excel and SPSS. Excel is preferred to SPSS in terms of charts and graphs since Excel has editable charts.