Это видео недоступно.
Сожалеем об этом.
How to measure fluorescence intensity within multiple regions of an image in ImageJ

HTML-код
- Опубликовано: 10 авг 2024
- This tutorial shows how to measure fluorescence intensity within multiple regions of interest in ImageJ
In this first part of the tutorial, I showed how to measure fluorescence intensity of a single region of interest and in the second part of the tutorial, I showed how to measure the fluorescence intensity of several regions within the image.
0:00 Introduction
1:00 Part 1: How to measure the fluorescence intensity of a single ROI
4:40 Part 2: How to measure the fluorescence intensity of several ROI
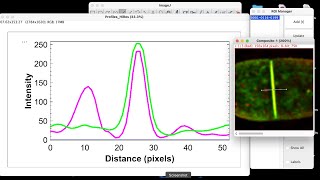
How to plot profile intensity for multiple fluorescence image in ImageJ: • plot profile intensity...
#ImageJ
#GrayValue
#Microscopeimage analysis


If it wasn't for your channel and these lessons, I wouldn't have been able to speak at the conference. You are an angel in the world of science ❤
You are very kind Alexander, thank you for your kind comment 😊
As usual, this is highly informative and educative for the targeted audience. 👏✍🙌
I appreciate that! thank you
Thank you for the clear explanation! This was very helpful!
You're welcome 😊
Glad you found it useful
Hi, your tutorials are really helpful! Thank you very much.
Hello, thanks for your kind comment 😊
Glad you found it useful 👍
Extremely helpful tutorial! Thank you!
You are welcome 😊
Years using imageJ, and finnaly i found a way to make my work less stressfull
THANK YOU A LOT!!!!!!!!!!!
You're welcome 😊
Muito obrigado pela sua aula! Parabéns!
De nada🥰
Dear Alicerita. I am 1000% Grateful to found your rich video on what I have been searching since months ago....Thanks so much for this tutorial. Wish to know how to plot EBT3 Films calibration equation using Image J. Thanks once more for this.....
Dear Annie,
I am glad you found the video useful, your kind comment makes me happy, thank you😊
@@AliceritaE Honestly, I am grateful for this. I am about to start analysing my research data, and was having stress on this. So, I really found your website on Time, and I will continue following all your great videos 😊😁💐
@Annie Thank you 😊 🙏 💓
It's very helpful
Thank you very much
I hope you explain how to measure scratch area by image j
Thank you for your kind comment and suggestion.
I will record another tutorial on how to measure Area, lengths and diameter.
useful!!
Glad you found it useful 👍
Thanks for the informative video! What image format did you use? (E.g. jpeg or tiff?)
You're welcome!
The image is the raw image file from Leica microscope. It was in .lif format before I opened it in imageJ.
Hi, thank you for the video. Is there a way to get accurate measurement of fluorescence intensity of an image with multiple cells? And if I try this method and there are parts of the image that do not have fluorescence(which are black) would that effect the results? Thank you!
Hello, thanks for watching.
You can use the free hand tools to draw around multiple cells to get an accurate measurement of the cell intensity.
If the black background contains noise, you might some value in the quantification data. But thus shouldn't be a problem because the the dark background usually have number much less than 10 depending on the clearness of the background
Great video. Please how did you get your second, third, and fourth ROI drawn?
Hi, thank you for your kind feedback back.
After you have drawn the first ROI, go to analyse // Tools// Roi manager
Then click on Add ROI.
Go to the next image, then click on the ROI to place the ROI on the new location you want
Thank you for the video. Please how can you count cells with image J and how can you count and identify the numbers of cell clusters/clumps in the cell population?
Also how can this be graphically expressed on image J?
Is it possible you send me a sample image to look at. Normally, I use watershed to split clustered object. Depending on what you are planning to show. You can use size distribution plot or a box plot chart to compare the size between samples
@@AliceritaE Thank you for your reply. Yes I'll send you a photo. How do you prefer I send a photo?
Or you can put it in a Google cloud and send the link
Alice4all42@gmail.com
Hi Nelson,
Did you find a solution to the task. Cheers
thanks for clear explanation, how can you copy the selection to create 4 shapes of same size? thanks again
Thanks for yourbkind comment.
You can copy the selection by ADDING THE SELECTION TO ROI manager (press T on thr keyboard)
You can click on the next image and click on the roi manager.
Alternatively,
You can use shift + control E to paste the selection on the next image
@@AliceritaE thanks very much
You're welcome 😊
I had same problem
Please Dear Dr, I can't still select the next image...
do you know what units the results are in (specifically mean) and can you change these units?
Also, how should you interpret the mean gray value as fluorescence intensity?
thanks so much
The mean grey value is shows how bright the dye or fluorescent protein was within the measured area. This can be compared with other treatments to see the difference in intensity between samples/treatments
Thanks! Just a follow up:
What are the units that this is given in? Like lux, cm2, etc
The sum of pixels within the measured area (area unit is dependent in the image format, e.g if you saved the image in the original microscope file format, the area would be in microns)
Can you explain the difference in the bright and fluorescence channel measurements?
Hi, do you mean the difference between the brightfield and the florescent channel
can you tell me the step of selection of multiple regions, which button on the keyboard, please
Hi Esraa, After drawing the first selection, press T on the keyboard. Then use the mouse to move it to other area in the image and press T again. Do this as many time as you want.
Then from the ROI manager that opens up when you pressed T. Tick show all to view all the selections on the image.
Mam can u pls tell me how do we take it further from the excel sheet ? What plot do we use ? Pls
Hi Jocelin, the type of plot depends on what you want to show. if you want to compare the intensity between two or three types of samples, you can you a boxplot or violin plot.
if it's just to show a single sample. I will recommend to use a profile plot to show the intensity for just a single sample. I have a video for that.
Thank you 😊
Dear Alicerita, thanks for this informative video, it helped so much. I would like to ask how can I decide whether I should look at the fluorescence intensity in the entire sample or just in a region of interest, and how can I select the same area in each sample? Or would it be wrong to analyze without choosing a region of interest? Thank you so much.
Hi @Merveemen3838, if you would like to use the same size of ROI for your quantification, then it's important to save the ROI coordinate in the ROI manager, as shown in this video. Then, you can copy and move the ROI to different areas of the cell to measure the intensity. But it is best to label each region that you want to measure,.so that the intensity is representative within sample size. Example left upper region of the cell label A, middle region label B and right lower region C.
This you have to decide by yourself and then keep it consistent.
@@AliceritaE Thank you so much for the response. It was so helpful.
@merveemen3838 you are welcome 😊
@@AliceritaE Dear Alice, is calibration required to measure fluorescence intensity? Thank you so much, your videos helping me so much.
If you're using the original file from the microscope. ImageJ will automatically detect the meta data and present the pixel value per micron area.
How did you add multiple regions of interest? When I do that the first one disappears.. It is not clear what you click to add multiple rectangles like that
I added them to the ROI manager and ticked on the ROI manager to show all the ROI on the image.
@@AliceritaE My question is how did you add the same sized square to different regions in the image itself?
@@AliceritaE When I try to do that the original ROI I made first is the one that moves
@rodainahazem8042 I moved the first ROI to a different point in the image and pressed "T" on the keyboard. This adds the coordinate yo the ROI manager.
@@AliceritaE Thank you! I used the shift + E command too based on a previous reply I saw you put to a commentor below. Thank uou.
hello, pls I need to talk to you.
Hi, how may I be of help