Update 18/08/2022: To generate the profile plot, go to PLUGINS >> GRAPHICS >> RGB PROFILE PLOT. It seemed the path was modified, you can then proceed as shown in this video was You can download the RGB profiler here; imagej.nih.gov/ij/plugins/rgb-profiler.html
This is exactly what I am looking for, but it was so hard to find anything useful online on how to do this. Thank you so much for making this tutorial! Easy to follow and clear!
@@AliceritaE Welcome hehe. You deserve it. I was struggling to make a plot using 4 different channels. Luckily found your video and it also made my day too. Good luck and keep doing more
Thanks for the toturial, its very helpful. I would like to have some help in analysing the width of peaks on plot profile. I hand draw straight line across the peak and measure it, but it seems not accurate enough. Could you please help?
Hello, could you please export the plot as .csv so that you can use excel to report the graph and correctly analyse the peak. To export the plot, click on the Data icon and select export as .csv
Update 18/08/2022: To generate the profile plot, go to PLUGINS >> GRAPHICS >> RGB PROFILE PLOT. It seemed the path was modified, you can then proceed as shown in this video
@@AliceritaE Hi it was nice, I have one question how to profile plot with the mean intensity and relative distance for multiple 3D spheroids with multiple channel, thanks :)


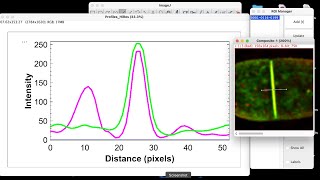


Update 18/08/2022: To generate the profile plot, go to PLUGINS >> GRAPHICS >> RGB PROFILE PLOT.
It seemed the path was modified, you can then proceed as shown in this video was
You can download the RGB profiler here; imagej.nih.gov/ij/plugins/rgb-profiler.html
This is exactly what I am looking for, but it was so hard to find anything useful online on how to do this. Thank you so much for making this tutorial! Easy to follow and clear!
Cheers Marissa!
I'm delighted you found the tutorial useful
This is easy to follow and your voice was clear. thanks for the tutorial
Thank you for your kind feedback 😊
Hello, Alicerita
Thank you so much for your tutorial they are helpful and easy to understand. I appreciate your work
Hi Odko Odko,
Thank you for your kind comment, it made my day 😊
@@AliceritaE Welcome hehe. You deserve it. I was struggling to make a plot using 4 different channels. Luckily found your video and it also made my day too. Good luck and keep doing more
Thank you, Odko Odko!
I wish you a beautiful day
I love you so much!!! Thank you for this video.
You're welcome, Christina!
So clear. Many many thanks.
I'm glad you found the tutorial useful, thanks for your kind feedback 😊
I love your videos and there are really useful !
Thanks a lot !!
You're welcome Oscar, Happy Easter holidays
Clear and useful; Thanks for the tuto :D
Hi Youness, I'm glad you found the tutorial useful. Cheers
Thanks for the toturial, its very helpful.
I would like to have some help in analysing the width of peaks on plot profile.
I hand draw straight line across the peak and measure it, but it seems not accurate enough.
Could you please help?
Hello, could you please export the plot as .csv so that you can use excel to report the graph and correctly analyse the peak.
To export the plot, click on the Data icon and select export as .csv
@@AliceritaE Thanks for the reply. It helps! Have a nice day,.🥰
You are welcome
Very useful, thanks very much 👍
You're welcome, Sanjay.
Hi Alicerita,
How do I quantify a multispectral IF image using Image J. I have IF images which has 4 colours for 4 proteins
Hello Wako, what is an IF image? Can you send me an example via email alice4all42@gmail.com
Very impressive, thank you
Cheers!
I could not find add to plot option in the image window. Could you please help ?
Hi, please check the pinned comment
Update 18/08/2022: To generate the profile plot, go to PLUGINS >> GRAPHICS >> RGB PROFILE PLOT.
It seemed the path was modified, you can then proceed as shown in this video
@@AliceritaE thank you...will check it :)
I have pasted it to you
@@AliceritaE thank you 😊
Nice one sis
Thank you 😊
@@AliceritaE Hi it was nice, I have one question how to profile plot with the mean intensity and relative distance for multiple 3D spheroids with multiple channel, thanks :)
Hi,
Do you mean you want profile plots for multiple 3D spheroids in a single plot
Thanks, how to save the profile image you made?
You're welcome. Go to file>> save as >> jpeg/Tiff
Thank you very much! @@AliceritaE
@TanTan-ch3vq you are welcome