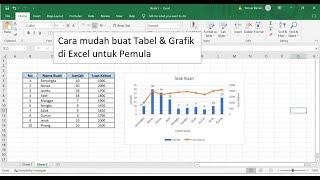
Easy Ways to Make Bar Charts in Microsoft Excel

HTML-код
- Опубликовано: 5 сен 2024
- In this Video Tutorial, we will discuss the steps for making a Bar Chart and the Custom Steps in Microsoft Excel. A graph is a presentation of data in a table which is then displayed in the form of an image. In addition, the meaning of graphics is a combination of numbers, letters, symbols, pictures, symbols, and paintings presented in the media with the aim of providing an overview of data from the material presenter to the recipients of the material in the process of providing information.
Graph Functions:
1. Describing quantitative data in a simple form but described in detail and detail.
2. Describe the development, comparison of an object or event that is related to each other briefly, concisely and clearly.
If there are still those who don't understand or are confused, please write them in the comments column. Thank you for watching the video, don't forget to like and subscribe.
#Excel
#BarChart
#CustomDiagram
#ExcelBasic
#LadangTutorial


Wahhhh nyimak bro jdi nambah wawasan liat video ini nambah ilmu lagi
terimakasih banyak pak
semoga berkah lncar segala urusan dan usahanya:)
Nambah ilmu gan...
Terimakasih ilmunya pak.... Semoga bisa lebih bermanfaatLagi..
Aamiin 😇
Terimakasih ilmunya 👍
Semngat bikin konten tentang excel bangg
Alhamdulillah terima kasih pak☺️
Min kok di Excel saya ngg muncul grifk nys
Makasih, Mas, ngebantu banget!
Tq
cara membesarkan ukuran batangnya gimana pak?
Cara buat tabel prosentase gmn y?
Excel nya pakai yang tahun berapa ya?
Excel nya tahun brapa ka
Qnjiang ang
.