This was a great guide to building dashboards. I’ve also been using the Astirna New Tab extension to manage my tasks better, which complements my work in Excel nicely.
Beautiful! So glad you put so much thought into the explanation and the timing of this video. I enjoyed the zooming in too. Thanks so much for sharing!
This is one of the best Video Presentations on creating an Excel Dashboard. This is a must watch presentation for anyone who wants to learn how to create a dashboard. Very useful tips too. A perfect Step-by-step guide. Thank you for sharing.
@@skillnatorif I want to share this dashboard without master file and dashboard is working properly how to be do that please help because my data is huge
I was looking for totally different video about formating. I am so very tired of this enormously heavy buttons/shapes setups with VBA, while looking for something simple and elegant. Thank you so much. Greetings from Germany.
Loved the step-by-step approach in this video. I recently downloaded the Astirna New Tab extension to help with my organization while using Excel, and it’s been useful.
Greetings Sir! Great Tutorial, I must say! I watched this tutorial and my feedback on this is that, who so ever wanted to [a. learn to write queries] or to [b. filter information from the data] or [c. write special functions], on MIS or day to day reporting will get all in this single tutorial, I bet they will survive! PS the best part was the positive and negative indicators, Fantastic.
you are most amazing and brilliant teacher I have ever seen.You give the explanation so clearly.I understand all of steps.Thank you so much.I am really grateful.
TLDR: The key idea of the video is to demonstrate how to create an interactive Excel dashboard using pivot tables, custom formatting, dynamic charts, filter buttons, and slicers. 1. 00:00 📊 Create an interactive Excel dashboard with a logo, six boxes, and a separator line using pivot tables, custom formatting, and dynamic charts. 1.1 Learn how to create an interactive and visually appealing Excel dashboard in five steps, including working with pivot tables, custom formatting, and dynamic charts. 1.2 Create a logo in the top left corner, six boxes, and a separator line in an Excel dashboard. 2. 03:13 📊 Set up tables, charts, and filter buttons for an interactive Excel dashboard displaying sales, profit, and growth data, with the ability to filter by category, segment, or ship mode. 2.1 Set up four tables, a separator line, two charts, and filter buttons for an interactive Excel dashboard, with data points including sales numbers for the latest and last year, growth, profit numbers for the latest and previous year, and profit growth, all connected to buttons. 2.2 Enable user to filter boxes by category or segment, with four tables showing sales data for top subcategories and states, and two charts displaying sales and price by quarter and top states, all filterable by category, segment, or ship mode. 2.3 Rename wireframe sheet as dashboard wireframe, make a copy called dashboard final, rename sheet1 as source data, set up a pivot table showing sales and profit data for the top 6 boxes for the latest two years, and format sales and profit values as numbers. 3. 08:12 📊 Create interactive Excel dashboard by setting up filter buttons with slicers for category and segment fields, creating pivot tables for sales by subcategory and cities, and linking them to slicers for filtering. 3.1 Set up filter buttons for the dashboard by creating slicers for the category and segment fields in the pivot table. 3.2 Create a pivot table that shows sales by subcategory for 2017 and 2016, filtered by category, and another table filtered by segment, as well as sales by cities, with the top 10 values displayed in descending order of sales. 3.3 To create an interactive Excel dashboard, add a filter or slicer for each pivot table and use the filter connections option to determine which slicer is impacting each table. 3.4 Set up a second table showing sales by cities for the top 10 cities, either by creating a new pivot table and linking it to the slicer or by copying an existing pivot table and linking it to the slicer. 4. 14:15 📊 Replace City field, filter top 10, sort sales descending, and copy tables. Disconnect/connect pivot tables to slicers. Set up table for sales and price trends by quarter for last 4 years. 4.1 Replace the field with City, apply a value filter of top 10, sort in descending order of sales, and copy identical tables to save time. 4.2 The speaker explains how to disconnect and connect pivot tables to different slicers in order to impact specific tables, and mentions the need to set up a table for the trend of sales and price by quarter for the last four years. 5. 17:13 📊 Create an interactive Excel dashboard by selecting and organizing source data, adding sales and quantity values, calculating price, choosing between pivot or bar charts, linking data outside of pivot tables, setting up filter buttons, and connecting slicers to pivot tables. 5.1 The speaker explains how to select and organize source data in Excel to create an interactive dashboard. 5.2 Add sales and quantity to the values for the chart, calculate the price based on sales and quantity, change the table layout to tabular format, choose between a pivot chart or a general bar chart, and link the data outside of the pivot table using formulas. 5.3 Add a price column by calculating sales divided by quantity, format the numbers as currency, set up a column chart with a second series for pricing, change the series type to line, and plot the pricing series on a secondary axis. 5.4 Create a copy of the last pivot table to display the states with the highest and lowest sales, set up filter buttons (slicers) for ship mode, category, and segment, and connect the slicers to the appropriate pivot tables. 6. 22:54 📊 Insert a logo and customize colors for an interactive Excel dashboard, then format shapes, align elements, and add transparent text boxes for headings. 6.1 To create an interactive Excel dashboard, insert a logo, set up color customization, and all elements in the workbook will adopt the same color. 6.2 Basic formatting is done to create a shape, remove outline and add shadow, align multiple shapes in the middle, and add a text box with transparent background for the heading of each card. 7. 25:53 📊 Create an interactive Excel dashboard by using self-referencing formulas, formatting techniques, and linking table ranges to pivot tables, and format positive numbers as green and negative numbers as red using custom formatting with color codes. 7.1 To create an interactive Excel dashboard, the speaker demonstrates how to use self-referencing formulas, formatting techniques, and linking table ranges to pivot tables on the working sheet. 7.2 Calculate and format positive numbers to appear green and negative numbers to appear red in an Excel dashboard by using custom formatting with color codes. 8. 29:55 📊 Set up tables and charts, format slicers and charts, fix errors and remove grand totals, add option button for sorting, and dynamically change chart title based on user selection. 8.1 Set up tables and charts, cut and paste them onto the dashboard sheet, format the slicers to look like buttons, increase the number of columns, remove slicer borders, and uncheck the display header for all slicers. 8.2 Format the charts by increasing the gap width of the bars, adding shadow, converting the axis to thousand units, adding data labels to the pricing line, making all fonts black, and removing borders; insert triangles for positive and negative numbers using the Arial font and custom formatting, and copy and paste the formatting on other columns. 8.3 To fix errors and remove grand totals, apply an if-then-else logic to the relevant cells and pivot tables in Excel. 8.4 Add an option button to allow users to select either the top or bottom 10 states by sales, and use a combination of switch and sort formulas to sort the values in ascending or descending order based on the user's selection. 8.5 The chart title can be dynamically changed to show either the highest or lowest option selected by utilizing a switch formula and concatenating the result to create the title.
Greetings from Turkey, I follow even though I am not fluent in English. I commend you too, Fantastic example!! Very interesting and informative. Easy to follow ❤ I can’t wait to build my own dashboard using these techniques!! 🎉
This is the best excel training i had ever had in years. It was so easy to follow and direct. However, in a case where you have large filter list, how then do you work that out. Also, i observed this could only be done when you have enough data. However, this is a great lesson. Thank you @skillnator.
Additional tip: change the property of the size/position of the slicers to diabling from moving or resize to prevent the user from accidentally messing them up Update: I tried to create the switch button option but my version of Excel is 2010, so it has no "SWITCH" function nor "SORT" function to use. Instead I use macros. Works fine.
Not using Tables as your source data means the PivotTables aren't dynamic. Is there a reason why you decided to forego setting up the source data in a Table container? Otherwise, nicely done. (from an Excel trainer of 35 years ;-))
Thank you for sharing the knowledge, really appreciate that, but still having #spill error on the switch formula, could you possibly sent me more steps explaining the switch formula? Thank you
hi, #spill occurs because we use array in our formulas, therefore, when insert formulas, we have to choose ALL cell and PRESS: Ctrl + Shift + Enter to activate array and the result will be like this ={SWITCH(G62,1,SORT(A63:B111,2,-1,FALSE),2,SORT(A63:B111,2,1,FALSE))}
Hi, thanks for sharing your knowladge... I am trying to follow step by step but when doing the first pivot table, by dropping the sales date into raws, i dont get the years, quartes, etc... (dropdown) i cant even group the dates to get them by years, how can i fix this? thank you so much....
Hi, I really admire the fantastic dashboard you've created-it's been incredibly helpful! Could you please share the source of the dataset you used? Thanks!
This is very useful and great project.I wonder if you can offer individual training.Im struggling to create one with the different set of data. Please advise.
Its an amazing video I learned a lot from it however I have one question its regarding about last 2 minutes(to be precise when the video is on 38.45minutes, how were you able to change the value (number 1 to 2) in option when you were typing the switch and sort, in between typing formula. if its automatic due to formula so its not happing for me
Fantastic learned alot more about pivot tables , charts & formating, but noticed still growth error for 2 cities ( Lafayette ( corporate) & Home Office (Providence & Richmond )due to no data for one of years . solves by combining "IF" & "ISNUMBER" e.g. Cell X19 ....=IF(AND(ISNUMBER(V19),ISNUMBER(W19)),V19/W19-1,"N/A"). Copy formulas to relevant "VS PY" headings
@Skillnator Thank you walking us through such informative dashboard. I tried replicating the same. I have facing an issue with Slice + Text box at top. I am having to reconfigure the formula every time. Although it setup as dynamic, When i open file next time and try to check filters- the data remains same. only after i reconfigure the cell does the text box become dynamic. Is there any way to fix this issue ?
amaaaaaaaaaazing ! very easy to follow and detailed enough to get lost while following along. i wish to see a video on creating a dashboard of multiple data sets (to connect multiple tables).
I really love the switch option, but I also have a slicer by location and some locations dont have any data. Even after modifying my switch formula to not return them it is still showing 0 value in my bar chart. I already tried the "hidden cells" changed to show gaps instead of zeros but I want the chart to resize appropriately based on present values rather than having placeholders when theres only 3 of top 10 values. Is there a way to do this or am I just wishing excel was like Power BI?
Great Video and Well Explained. The only part i was unable to get it was how you assign roles to Top 10 and Bottom 10 button as video skipped one part I guess around the time stamp 38:00 till 38:55. Please help to clarify. @Skillnator
we use array in our formulas, therefore, when insert formulas, we have to choose ALL cell and PRESS: Ctrl + Shift + Enter to activate array and the result will be like this ={SWITCH(G62,1,SORT(A63:B111,2,-1,FALSE),2,SORT(A63:B111,2,1,FALSE))}
Is all the functionality on your dashboard available on the online version of excel? I'm having trouble using text boxes with dynamic cell references while using the online version. Are dynamic text boxes limited to desktop excel?
Hi at work i use this method Tag all data ( actually i have a named range to cover the colums data - item type sales qty - sates $$$ ), create the pivot, place date in the colum label/option and sales in the sun label/option Run the pivot Now move the mouse to the pivot result on top of the first date shown left click the first date to select it, right click, mouse down to group, now tick year quarter month, this will now show the data with 3 expand/colapse options in the view Now it will display it again in month but you can group months into quarts to hide details or old data into years You can introduce a new field in your original data, i call it last years date, all i do i create a new colum after the sales $$$, i grab the first field and make the formula = "select the original date field" - 365 so lets say the first data in the table is cell A2 the first date = 1/1/2020 , the new colum eg G2 is now1/1/2019 Now you need a vlookup in colum H, the vlookup will take G2 ( which is a date 1 year ago ) then you vlook up your original data and grab the sale from a year ago Now when you create your pivot you can add this new vlook up sales or data and it will show your current query plus the information from a year ago in the next field Otherwise igonore my option 2 i described above just create a second pivot under the main one and change you query filter a year earlier


This was a great guide to building dashboards. I’ve also been using the Astirna New Tab extension to manage my tasks better, which complements my work in Excel nicely.
Have just created my first ever dashboard after watching your video - absolutely brilliant, thank you so much!! My boss was impressed too 🙂
Beautiful! So glad you put so much thought into the explanation and the timing of this video. I enjoyed the zooming in too. Thanks so much for sharing!
if only i could like this video a million time! Appreciate the effort to guide us through, it is fantastic and absolutely helpful.
Thank you very much. I am starting a career in Data Analysis and I have been getting my excel skills up to speed. This is very informative. Blessings
This is one of the best Video Presentations on creating an Excel Dashboard.
This is a must watch presentation for anyone who wants to learn how to create a dashboard.
Very useful tips too.
A perfect Step-by-step guide.
Thank you for sharing.
This is bloody brilliant! Thanks SO MUCH!
Very informative and useful video i have ever seen so far on excel dashboard
simply to understand and easy to follow, thank you very much
You teach well. All the relevant aspects are included in your video. Brilliant!!!
Fantastic example!! Very interesting and informative. Easy to follow ❤
I can’t wait to build my own dashboard using these techniques!! 🎉
Glad you enjoyed it!
@@skillnatorif I want to share this dashboard without master file and dashboard is working properly how to be do that please help because my data is huge
Awesome video and I learned a lot of Excel tricks 🙌🏼
I was looking for totally different video about formating. I am so very tired of this enormously heavy buttons/shapes setups with VBA, while looking for something simple and elegant. Thank you so much. Greetings from Germany.
Excellent expression to create a dashboard with data.
Absolutely mind blowing! Thank you for such an informative video. Looking forward to building my own Dashboard now 🙂
Loved the step-by-step approach in this video. I recently downloaded the Astirna New Tab extension to help with my organization while using Excel, and it’s been useful.
Thank you so much! Clear explanation and steps.
Best dashboard video tutorial. Thanks so much.
There's no reason why I should not like and subscribe. This is more than mind blowing
Thank you!
Greetings Sir! Great Tutorial, I must say!
I watched this tutorial and my feedback on this is that, who so ever wanted to [a. learn to write queries] or to [b. filter information from the data] or [c. write special functions], on MIS or day to day reporting will get all in this single tutorial, I bet they will survive! PS the best part was the positive and negative indicators, Fantastic.
Thank you so much! Glad you liked the video!
you are most amazing and brilliant teacher I have ever seen.You give the explanation so clearly.I understand all of steps.Thank you so much.I am really grateful.
Hello @SkillNator, may God bless you a lot. You are so good in your job.
Thanks for Creating us outstanding exposure to dashboard
Could you please a video explaining the last part of adding button to dashboard and linking them in a little more detail. It would be really useful.
I watched some others too, but this one is excellent!
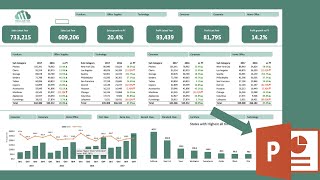
TLDR: The key idea of the video is to demonstrate how to create an interactive Excel dashboard using pivot tables, custom formatting, dynamic charts, filter buttons, and slicers.
1. 00:00 📊 Create an interactive Excel dashboard with a logo, six boxes, and a separator line using pivot tables, custom formatting, and dynamic charts.
1.1 Learn how to create an interactive and visually appealing Excel dashboard in five steps, including working with pivot tables, custom formatting, and dynamic charts.
1.2 Create a logo in the top left corner, six boxes, and a separator line in an Excel dashboard.
2. 03:13 📊 Set up tables, charts, and filter buttons for an interactive Excel dashboard displaying sales, profit, and growth data, with the ability to filter by category, segment, or ship mode.
2.1 Set up four tables, a separator line, two charts, and filter buttons for an interactive Excel dashboard, with data points including sales numbers for the latest and last year, growth, profit numbers for the latest and previous year, and profit growth, all connected to buttons.
2.2 Enable user to filter boxes by category or segment, with four tables showing sales data for top subcategories and states, and two charts displaying sales and price by quarter and top states, all filterable by category, segment, or ship mode.
2.3 Rename wireframe sheet as dashboard wireframe, make a copy called dashboard final, rename sheet1 as source data, set up a pivot table showing sales and profit data for the top 6 boxes for the latest two years, and format sales and profit values as numbers.
3. 08:12 📊 Create interactive Excel dashboard by setting up filter buttons with slicers for category and segment fields, creating pivot tables for sales by subcategory and cities, and linking them to slicers for filtering.
3.1 Set up filter buttons for the dashboard by creating slicers for the category and segment fields in the pivot table.
3.2 Create a pivot table that shows sales by subcategory for 2017 and 2016, filtered by category, and another table filtered by segment, as well as sales by cities, with the top 10 values displayed in descending order of sales.
3.3 To create an interactive Excel dashboard, add a filter or slicer for each pivot table and use the filter connections option to determine which slicer is impacting each table.
3.4 Set up a second table showing sales by cities for the top 10 cities, either by creating a new pivot table and linking it to the slicer or by copying an existing pivot table and linking it to the slicer.
4. 14:15 📊 Replace City field, filter top 10, sort sales descending, and copy tables. Disconnect/connect pivot tables to slicers. Set up table for sales and price trends by quarter for last 4 years.
4.1 Replace the field with City, apply a value filter of top 10, sort in descending order of sales, and copy identical tables to save time.
4.2 The speaker explains how to disconnect and connect pivot tables to different slicers in order to impact specific tables, and mentions the need to set up a table for the trend of sales and price by quarter for the last four years.
5. 17:13 📊 Create an interactive Excel dashboard by selecting and organizing source data, adding sales and quantity values, calculating price, choosing between pivot or bar charts, linking data outside of pivot tables, setting up filter buttons, and connecting slicers to pivot tables.
5.1 The speaker explains how to select and organize source data in Excel to create an interactive dashboard.
5.2 Add sales and quantity to the values for the chart, calculate the price based on sales and quantity, change the table layout to tabular format, choose between a pivot chart or a general bar chart, and link the data outside of the pivot table using formulas.
5.3 Add a price column by calculating sales divided by quantity, format the numbers as currency, set up a column chart with a second series for pricing, change the series type to line, and plot the pricing series on a secondary axis.
5.4 Create a copy of the last pivot table to display the states with the highest and lowest sales, set up filter buttons (slicers) for ship mode, category, and segment, and connect the slicers to the appropriate pivot tables.
6. 22:54 📊 Insert a logo and customize colors for an interactive Excel dashboard, then format shapes, align elements, and add transparent text boxes for headings.
6.1 To create an interactive Excel dashboard, insert a logo, set up color customization, and all elements in the workbook will adopt the same color.
6.2 Basic formatting is done to create a shape, remove outline and add shadow, align multiple shapes in the middle, and add a text box with transparent background for the heading of each card.
7. 25:53 📊 Create an interactive Excel dashboard by using self-referencing formulas, formatting techniques, and linking table ranges to pivot tables, and format positive numbers as green and negative numbers as red using custom formatting with color codes.
7.1 To create an interactive Excel dashboard, the speaker demonstrates how to use self-referencing formulas, formatting techniques, and linking table ranges to pivot tables on the working sheet.
7.2 Calculate and format positive numbers to appear green and negative numbers to appear red in an Excel dashboard by using custom formatting with color codes.
8. 29:55 📊 Set up tables and charts, format slicers and charts, fix errors and remove grand totals, add option button for sorting, and dynamically change chart title based on user selection.
8.1 Set up tables and charts, cut and paste them onto the dashboard sheet, format the slicers to look like buttons, increase the number of columns, remove slicer borders, and uncheck the display header for all slicers.
8.2 Format the charts by increasing the gap width of the bars, adding shadow, converting the axis to thousand units, adding data labels to the pricing line, making all fonts black, and removing borders; insert triangles for positive and negative numbers using the Arial font and custom formatting, and copy and paste the formatting on other columns.
8.3 To fix errors and remove grand totals, apply an if-then-else logic to the relevant cells and pivot tables in Excel.
8.4 Add an option button to allow users to select either the top or bottom 10 states by sales, and use a combination of switch and sort formulas to sort the values in ascending or descending order based on the user's selection.
8.5 The chart title can be dynamically changed to show either the highest or lowest option selected by utilizing a switch formula and concatenating the result to create the title.
Thank you for taking the time to write this. Very Helpful.
Greetings from Turkey,
I follow even though I am not fluent in English.
I commend you too, Fantastic example!! Very interesting and informative. Easy to follow ❤
I can’t wait to build my own dashboard using these techniques!! 🎉
thanks for the useful knowledge. May God give you health and blessings
Thank you so much!!
This an amazing video, extremely helpful and informative! Thank you very much for shring it with us.
Welcome! Glad you like it!
Can you please explain what cell reference you've put the switch and sort formula
Great video! Thanks for sharing.
I have been watching your video and it is excellent. Thank you so much for sharing this knowledge. I appreciate it.
what if one more new sub category comes up in the upcoming data.. then do we have to relink everything and make necessary spaces?
Amazing video. Thank you for putting in the time for others.
Very interesting and informative. Will surely try it.
This is the best excel training i had ever had in years. It was so easy to follow and direct. However, in a case where you have large filter list, how then do you work that out. Also, i observed this could only be done when you have enough data. However, this is a great lesson. Thank you @skillnator.
Love it!!! Thank you for sharing. You are amazing 🎉
You just got a new subscruber. Your tutorials ate the best
Additional tip: change the property of the size/position of the slicers to diabling from moving or resize to prevent the user from accidentally messing them up
Update: I tried to create the switch button option but my version of Excel is 2010, so it has no "SWITCH" function nor "SORT" function to use. Instead I use macros. Works fine.
Your approach is systematic and very neat!
deserve subscribe bro ! your dashboard video course was absolutley great easy to follow ! thanks
Thank you so much!!
Not using Tables as your source data means the PivotTables aren't dynamic. Is there a reason why you decided to forego setting up the source data in a Table container? Otherwise, nicely done. (from an Excel trainer of 35 years ;-))
I was wondering the same thing. I always start woth datasource as a Table...
Ctrl + T
Unrelated topic. Do you do personal training? And how much is your rates.
Thank you for sharing the knowledge, really appreciate that, but still having #spill error on the switch formula, could you possibly sent me more steps explaining the switch formula? Thank you
hi, #spill occurs because we use array in our formulas, therefore, when insert formulas, we have to choose ALL cell and PRESS: Ctrl + Shift + Enter to activate array and the result will be like this ={SWITCH(G62,1,SORT(A63:B111,2,-1,FALSE),2,SORT(A63:B111,2,1,FALSE))}
thank you...Great video....easy to follow through.
Hi, thanks for sharing your knowladge... I am trying to follow step by step but when doing the first pivot table, by dropping the sales date into raws, i dont get the years, quartes, etc... (dropdown) i cant even group the dates to get them by years, how can i fix this? thank you so much....
Very Nice.... interestingly and informative video
So clean, easy to follow through. Just earned yourself a subscriber mate.
Thanks for the sub!
Great Job, great job and, again, great job! 🙏
Thank you so much for this! It's very helpful.
Very Cool teacher!!!!! from Thailand.
Hi, I really admire the fantastic dashboard you've created-it's been incredibly helpful! Could you please share the source of the dataset you used? Thanks!
Hi, what's the shortcut to adapt the slicer size to the content as fast you did (timestamp : 9:20) ?
Wow. Thanks for sharing bro. Very informative.
Thank you so much. This is mind blowing video
Thank you very much. I do wish you have good healthy and wealthy forever!!!
This is very useful and great project.I wonder if you can offer individual training.Im struggling to create one with the different set of data.
Please advise.
Thank you for sharing this video @Skillnator, my concern is why is my " Order Date" format not in years! appears as individual days? anyone help?
very helpfull, great job, congratulations
You have created an excellent dashboard, thanks a lot for this informative video.
Thank you!! Glad you liked it!!
Perfect! Well done.
wooo
thanks very much
specials thank for sample file
I can follow your video step by step
This was a PHENOMENAL VIDEO!!! Thank you so much. Will absolutely be using this at my new job!! 💖
Awesome video - just earned yourself a subscriber.
Its an amazing video I learned a lot from it however I have one question its regarding about last 2 minutes(to be precise when the video is on 38.45minutes, how were you able to change the value (number 1 to 2) in option when you were typing the switch and sort, in between typing formula. if its automatic due to formula so its not happing for me
Thank you so much, Very helpful.
Great video with excellent examples and techniques
Fantastic learned alot more about pivot tables , charts & formating, but noticed still growth error for 2 cities ( Lafayette ( corporate) & Home Office (Providence & Richmond )due to no data for one of years . solves by combining "IF" & "ISNUMBER" e.g. Cell X19 ....=IF(AND(ISNUMBER(V19),ISNUMBER(W19)),V19/W19-1,"N/A"). Copy formulas to relevant "VS PY" headings
Thank you sir for easy teaching for our
terrific job, thank you.
Loved the video and deep discussion about each step and concept. Thank you so much for sharing!!
Thank you!
@Skillnator Thank you walking us through such informative dashboard. I tried replicating the same. I have facing an issue with Slice + Text box at top. I am having to reconfigure the formula every time. Although it setup as dynamic, When i open file next time and try to check filters- the data remains same. only after i reconfigure the cell does the text box become dynamic. Is there any way to fix this issue ?
Thanks a lot for a great video.
amaaaaaaaaaazing !
very easy to follow and detailed enough to get lost while following along.
i wish to see a video on creating a dashboard of multiple data sets (to connect multiple tables).
Learnt a lot from this. Thank you.
Lifesaver!! Thank you!
You are a life saver, amazing and so simple to follow
Thanks for the video. It was really helpful.
Excellent teacher
very detailed explained. thank you
Very interesting.I like very much, thank you, I will tray to make a dashboard.
@Skillnator What if we have two datasets? Do we have to merge it or we can use both as it is?
Best option will be to use power query and merge two datasets into one pivot table. Then create dashboard from that pivot table! Hope that helps!
Awesome content! Pls keep the good work!
Thanks, a lot, absolutely brilliant,
You are a lifesafer. Thank you
Awesome explanation!
Thanks for this video .. very useful and we can practice now,
I really love the switch option, but I also have a slicer by location and some locations dont have any data. Even after modifying my switch formula to not return them it is still showing 0 value in my bar chart. I already tried the "hidden cells" changed to show gaps instead of zeros but I want the chart to resize appropriately based on present values rather than having placeholders when theres only 3 of top 10 values. Is there a way to do this or am I just wishing excel was like Power BI?
Its great. Thank you so much.
Great Video and Well Explained. The only part i was unable to get it was how you assign roles to Top 10 and Bottom 10 button as video skipped one part I guess around the time stamp 38:00 till 38:55. Please help to clarify. @Skillnator
we use array in our formulas, therefore, when insert formulas, we have to choose ALL cell and PRESS: Ctrl + Shift + Enter to activate array and the result will be like this ={SWITCH(G62,1,SORT(A63:B111,2,-1,FALSE),2,SORT(A63:B111,2,1,FALSE))}
Is all the functionality on your dashboard available on the online version of excel? I'm having trouble using text boxes with dynamic cell references while using the online version. Are dynamic text boxes limited to desktop excel?
That really work POGchamp
How would you do if one would like to have the calculations based on this week, month, quarter and year vs. last ones? Please advise.
Hi at work i use this method
Tag all data ( actually i have a named range to cover the colums data - item type sales qty - sates $$$ ), create the pivot, place date in the colum label/option and sales in the sun label/option
Run the pivot
Now move the mouse to the pivot result on top of the first date shown
left click the first date to select it, right click, mouse down to group, now tick year quarter month, this will now show the data with 3 expand/colapse options in the view
Now it will display it again in month but you can group months into quarts to hide details or old data into years
You can introduce a new field in your original data, i call it last years date, all i do i create a new colum after the sales $$$, i grab the first field and make the formula = "select the original date field" - 365
so lets say the first data in the table is cell A2 the first date = 1/1/2020 , the new colum eg G2 is now1/1/2019
Now you need a vlookup in colum H, the vlookup will take G2 ( which is a date 1 year ago ) then you vlook up your original data and grab the sale from a year ago
Now when you create your pivot you can add this new vlook up sales or data and it will show your current query plus the information from a year ago in the next field
Otherwise igonore my option 2 i described above just create a second pivot under the main one and change you query filter a year earlier
Excellent presentation
thank you very much for the information 👍
Wow....Just subscribed!
Thank you!!
This is awesome !! Thank you for sharing!
Thanks for watching!
Gracias por compartir tus conocimientos
Please How did u insert the create PPT in the file and how it become so organized ?
No answer 😢
God job! 👍
Thank u so much for your effort.