This is absolutely the BEST, MOST CLEAR, STRAIGHTFORWARD VIDEO I have ever had the pleasure of learning from! Thank you for making my day! College science should ALL be done with videos like this one
Thank youuuu! I missed a biochemistry lab and I couldn't have done my practical exam without understanding this fully. Your explanations are so easy to follow. My lab book is covered in notes now :)
Thank you so much, I had to use a standard curve for something in uni and I had no idea what I was doing haha This is so clear and I finally understand it!
WOW! Thank you from the UK! My assignment is based on protein concentration in samples. This video explained it perfectly. I was clueless before I watched it! THANK YOU!!!!!
It depends on the solution, [FeSCN]^2+ for example is a reddish color solution, while Fe^3+ and SCN^- are essentially colorless. Since FeSCN^2+ reflects red light it absorbs BLUE light, so you find a wavelength in the blue light region! (I know this is a 5-year-old comment, but I just came across this video, hope this helps anyone!)
In my biochemistry unit we were told that if the absorbance is higher than the standard curve reads that we should dilute the unknown and then use the dilution factor to find the initial concentration. Is that not a solution to that problem, or can you do either?
I was going to wait for the video to at least get 1/3rd of the way before I was going to like it or not, but the Standard Curve definition and example with the consistently-themed penguin objects made me lol and informed, you deserve a like/sub!
Thank you so much! You did an amazing job of breaking it down...I've been in Molecular Biology class for a few weeks and during lab, the professor didn't bother to describe what a standard curve was. I was thinking, "where is the curve?!". I get it now, thanks to you.
Madam thkx daily routine doubt cleared for Created Standard curve to Measure Unknown Concentration Sample absorbance Within Known Created Std Curve Limit. One more Doubt to Create Known Standard Curve sample Nanometer need to take Peak or Valley range. Any 1 range Nanometer why its taking..
How to make the higher concentration of maltose standard curve, my values are not falling the standard curve. I take 0.2, 0.4, 0.6, 0.8 and 1ml of standard maltose and make up the volume to 2ml with distilled water
Thank you so much, but now I have done 10x and 100x dilutions and my prof has asked me to solve for X in both cases ( she did give me an equation) but I am list. Do you have a follow up video to this one?
Hi, i have just one question about the intercept. If my standard curve is not showing zero origin, will that be fine. Which one will be the best curve the one which starts from zero but all dot points are not touching the line or the other one which does not start from zero but all dot points are touching the line? Waiting for your reply. Thanks
Thank so much ma'am....that's topic make me so difficult to understand because already miss lectures by professor but now I totally got understood What exact standard curve is.....thank you again
Good day, need help. I need to prepare glucose standanrd curve in the range of (1-13mg/ml) How much distilled water need to be added if ; Example; 3mg glucose??
It depends on how much you need to make - you have the concentration (3mg/ml) so you can scale it up to make as much as you need (30mg/30ml) etc. The concentration is what's important, not the total volume. Hope that helps!
Could you also just dilute the sample 1:2 and then calculate the concentration? And thank you so much for the video!!! I finally understand clearly how it works!
Literally I watched and asked so many videos and people about this topic but still there are some lingering questions in mind. But this video cleared everything within 7 min. Tqsm
Glad I came across your video I now have a better understanding of this procedure. But as an insipiring analytical chemist, can you ever detect 0 ng of "stuff" or whatever is being sampled?
Hi. The best explanation so far. But I have a question. What happens if the concentration that you got is above the maximum concentration? should you accept or not? and What must you do so the concentration must be within the calibration curve? I hope you'll reply
Nice video, thank you. I have found a published standard curve for lutein (a carotenoid) (openi.nlm.nih.gov/detailedresult.php?img=PMC4206223_f02_00&req=4) but it says it is a chromatogram standard curve; can I use this for a spectrophotometric analysis of lutein concentration?
Excellent - clear, concise and educational! 2 questions, 1) How do you know what wavelength to use? 2) What is the difference between a spectrophotometer and a ELISA reader?
Once a standard curve has been made for a given compound could it be used to determine the concentration of the same compound in a solution made with a different solvent from the solution that was used to make the standard curve?
Always use the same solvent - if you change anything, you'll need to make new standards. Also remember that if you change the contents of your cuvettes, you'll need new blanks.


In less than 7 minutes, you've explained everything in lecture I zoned out on, omg thank you!!
This is absolutely the BEST, MOST CLEAR, STRAIGHTFORWARD VIDEO I have ever had the pleasure of learning from!
Thank you for making my day! College science should ALL be done with videos like this one
I'm so glad you found it useful!
instablaster
Thank youuuu! I missed a biochemistry lab and I couldn't have done my practical exam without understanding this fully. Your explanations are so easy to follow. My lab book is covered in notes now :)
+Francesca Hewitt I'm SO HAPPY!!! Thanks for watching and letting me know!
Kathryn Francesca what your University specialization??
I dont understand this curve in medical lab
Thank you so much, I had to use a standard curve for something in uni and I had no idea what I was doing haha
This is so clear and I finally understand it!
Fantastic and simple explanation for those of us who are assay beginners!
WOW! Thank you from the UK! My assignment is based on protein concentration in samples. This video explained it perfectly. I was clueless before I watched it! THANK YOU!!!!!
I will definitely subscribe. You are amazing explaining. Thank you so much.
So clear and simple! thank you
fantastic video!!
Thank you! So easy to understand my assignment now! LIFE SAVING work done here today. Thank you Penguin Prof!
Glad it helped! You are most welcome!
Thanks. It made it easier for me to understand it.
Excellent advice and methodology for making any measurement. Thanks!
straight to the point thank you!
thank you....easy to understand and very helpful
Thank you, you explained very clearly.....
Thank you, this is very informative
very well expalined.thank you.please make a video on TPC protocol and calculation
Thanks a lot. Really helpful.
May god bless you.
You are most welcome! Thanks for watching!!!
So enlightened
So happy to hear it!
How do you know which wavelength to use?
It depends on the solution, [FeSCN]^2+ for example is a reddish color solution, while Fe^3+ and SCN^- are essentially colorless. Since FeSCN^2+ reflects red light it absorbs BLUE light, so you find a wavelength in the blue light region!
(I know this is a 5-year-old comment, but I just came across this video, hope this helps anyone!)
Thank you so much
Or you can perform single/serial dilution, so that the unknown concentration falls within the 'ruler'?
omg you just helped me tremendously in my QBM class. Total ah-ha moment. thank you
I LOVE when that happens (and when people tell me about it!) Glad it helped!
Thank you is the most that I can say tbh! what an amazing video!
Wow, thank you!
Thank you so much! I really needed this clarity!!!!
You are so welcome! Thanks for watching!
Nice explanation
Thanks!
You've just made my life a bit easier. thank you
Woo hoo!!! Thanks for letting me know!
Oh thanks! Definitely helped me to understand for my biochemistry lab report!!
Great Video! Tkank you so much! Best regards from student from Poland ahhaha!
I'm so glad it helped! Thanks for watching!
thank you so much, it is very helpful
I'm so glad! You are so welcome.
Ahhhh. I understand this now. I didn't in my class. Thank you very much.
Thank you so much,
Thanks you made it so much simpler than my professor did!!!!
Ma'am you are amazing ❤️Please make more videos like this😘
Thanks so much! I will!
thank you so much for your video. really helpful, easy to understand.:)
this was so freakn easily explained! ahh thank you so much
thanks!!! for the firs time of my academic life i know in 100% what the %&* is a standard curve!
+בן קלמן YIPPEE!!!!!! Thanks for letting me know. :)
You are absolutely amazing!! God bless u!!
thanks for helping me do prelab lol
That's what I'm here for! :) Glad it was helpful.
In my biochemistry unit we were told that if the absorbance is higher than the standard curve reads that we should dilute the unknown and then use the dilution factor to find the initial concentration. Is that not a solution to that problem, or can you do either?
Really good brush up lesson, cheers :D
Mam
but when we have to measure the concentration of [eg. Sucrose unknown] than also we can use the standard curve of protein?
No. It's specific to each substance you are working with.
How do you know which wavelength to use?
thanks very well explained, you must REALLY love penguins. haha
I was going to wait for the video to at least get 1/3rd of the way before I was going to like it or not, but the Standard Curve definition and example with the consistently-themed penguin objects made me lol and informed, you deserve a like/sub!
I'm so glad to hear it - thanks so much!
Thank you so much! You did an amazing job of breaking it down...I've been in Molecular Biology class for a few weeks and during lab, the professor didn't bother to describe what a standard curve was. I was thinking, "where is the curve?!". I get it now, thanks to you.
Madam thkx daily routine doubt cleared for Created Standard curve to Measure Unknown Concentration Sample absorbance Within Known Created Std Curve Limit.
One more Doubt to Create Known Standard Curve sample Nanometer need to take Peak or Valley range. Any 1 range Nanometer why its taking..
How to make the higher concentration of maltose standard curve, my values are not falling the standard curve. I take 0.2, 0.4, 0.6, 0.8 and 1ml of standard maltose and make up the volume to 2ml with distilled water
Why is it that we can use a standard curve of one protein to determine values of a completely different protein?
Thank you so much, but now I have done 10x and 100x dilutions and my prof has asked me to solve for X in both cases ( she did give me an equation) but I am list. Do you have a follow up video to this one?
Helpful 💯❤️☝
So glad!
this was generally one of the best videos I've ever come across, thank you so much!
Thanks so much! Glad it was helpful.
I have question..
Can you solution by regression line equation if absorbance more than 1.4?
Hi, i have just one question about the intercept. If my standard curve is not showing zero origin, will that be fine. Which one will be the best curve the one which starts from zero but all dot points are not touching the line or the other one which does not start from zero but all dot points are touching the line? Waiting for your reply. Thanks
Do not plot (0,0) in your standard curve. Make a best-fit line with the data points you have - it's rare the line will go through the origin.
ThePenguinProf thanks heaps.. it clears my mind .👍
nice Video!
wow
Thank you! Cheers!
you're so kind i was desperately looking for this. thank you so soooo much!!!!
I'm so glad you found me! You are sooooo welcome!
Your video is amazing.
Thank you! Glad it was helpful.
You are a LEGEND! Thank you so much!
You are the best!!! This is a really good contribution.
Thanks for watching!
Thank so much ma'am....that's topic make me so difficult to understand because already miss lectures by professor but now I totally got understood What exact standard curve is.....thank you again
helpfull
Wow mam u r excellent ❤️ thank u for clearing my confusion.
I'm glad you found it helpful!
Good day, need help.
I need to prepare glucose standanrd curve in the range of (1-13mg/ml)
How much distilled water need to be added if ; Example; 3mg glucose??
It depends on how much you need to make - you have the concentration (3mg/ml) so you can scale it up to make as much as you need (30mg/30ml) etc. The concentration is what's important, not the total volume. Hope that helps!
Can we call it a caliberation curve??
Such clarity, that too in one shot🙏 wonderfully explained, Mam
Thanks 🌸
So kind of you to say! Glad it was helpful!
Could you also just dilute the sample 1:2 and then calculate the concentration?
And thank you so much for the video!!! I finally understand clearly how it works!
It's a complex relationship, so don't dilute and calculate... dilute and measure the ABS. Be safe. Glad it was helpful!
Literally I watched and asked so many videos and people about this topic but still there are some lingering questions in mind. But this video cleared everything within 7 min. Tqsm
Glad I came across your video I now have a better understanding of this procedure. But as an insipiring analytical chemist, can you ever detect 0 ng of "stuff" or whatever is being sampled?
Hi. The best explanation so far. But I have a question. What happens if the concentration that you got is above the maximum concentration? should you accept or not? and What must you do so the concentration must be within the calibration curve? I hope you'll reply
If your unknown concentration is above the standard curve, you need to make new (higher concentration) standards -- never extrapolate!
Nice video, thank you. I have found a published standard curve for lutein (a carotenoid) (openi.nlm.nih.gov/detailedresult.php?img=PMC4206223_f02_00&req=4) but it says it is a chromatogram standard curve; can I use this for a spectrophotometric analysis of lutein concentration?
you are really amazing easy explanation >>thank you so so much
+sufian algohary You are welcome! Thanks for watching!
I used increasing volumes from 0.1ml to 0.8ml from a protein solution of 20mg/100ml how do I get concentration?
I love this video i ask for more: coefficients of variance. And controls meaning vs calibrators please.
waoooow,,, i like it thank you
Your link not exist 😢
My problem sorted😁
I have been struggling to find the values watched so much stuff but youu explained it soo smoothly god bless uh🌈⭐
Made that look easy ☺️
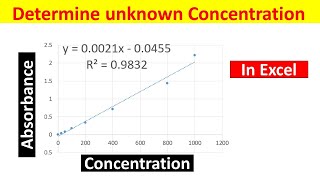
you say concentration vs Absorbance but your plot is abs vs conc...so what's happening there
Omg thank you so much for this knowledge you saved my academic life
Wow!!! You are so welcome!
Nice presentation I really impressed good work thank you mam
Thank you for watching! Glad it was helpful.
couldn't understand when my teacher taught me, but I got it first try when you did, thank you!!!!!!!
I was hoping you were explaining how we can find that concetration with Beer and Lambert's rule....
Excellent - clear, concise and educational! 2 questions, 1) How do you know what wavelength to use? 2) What is the difference between a spectrophotometer and a ELISA reader?
Once a standard curve has been made for a given compound could it be used to determine the concentration of the same compound in a solution made with a different solvent from the solution that was used to make the standard curve?
Always use the same solvent - if you change anything, you'll need to make new standards. Also remember that if you change the contents of your cuvettes, you'll need new blanks.
Thank you so much from Africa, i just subscribed. That biochem lab won't know what hit it.
I have a question.... It is not necessary to construct the curve form 0,0 coordinates?
No. The curve will rarely go through the origin.
You are amazing!!!
It helped me a lot. Thanks 🙏
Glad it helped!
Loved your explanation! Didn't have slightest idea in class what the standard curve is... Thank you!
AMAGAAAAAA THANK YOU SO MUCH
for the longest time I felt so intellectually impaired but this video helped me loads
Really great video I didn't understand it in class and this video was so helpful and easy to understand. Thanks so much!!!
Awesome👌👌👌👌
Thank you so much for your detailed lecture.. I just loved it. It provides all basic answers of mine about this topic.
Good luck 😊
My online course is using this video as learning tool. Thanks :) Your video really helped.
Simple yet powerful explanation on stamdard curve and dealing with out of range samples.
Wow!!! no one can explain better than you!!! awesome presentation!!! Thank you so much!!
Nice and clear explanation! Thanks!
Glad it was helpful!
Finally in second attempt I understood
Woo hoo! That's awesome!!!
My prof walked out the class once. Just sharing