How to analyze Likert Scale in SPSS and interpret the results in Word

HTML-код
- Опубликовано: 29 авг 2020
- 📌📌📌 For assistance with data analysis of different Likert Scales, kindly contact me via this email: datanalysis93@gmail.com or WhatsApp: +212619398603
Facebook: / benhima1
Instagram: / medbenhima2015
Linkedin: / mohamed-benhima-6a1087109
Twitter: / mohamed_benhima
WhatsApp: +212619398603
E-mail: Datanalysis93@gmail.com
~~~~~~~~~~~~~~~~~~~~~~~~~~~~~~~~~~~~~~~~~~~~~~~~~
How to analyze a Likert scale in SPSS and interpret the results of Likert-scale;
How to interpret the mean of a five-point Likert scale
~~~~~~~~~~~~~~~~~~~~~~~~~~~~~~~~~~~~~~~~~~~~~~~~~
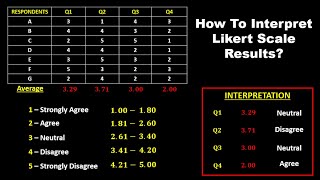
1. Strongly Disagree : [1: 1.80)
2. Disagree [1.80: 2.60)
3. Neither agree or disagree [2.60: 3.40)
4. Agree [3.40: 4.20)
5. Strongly agree [4.20: 5]
Reference: Pimentel, J. (2010). A note on the usage of Likert Scaling for research data analysis. USM R & D, 18, 109-112.
~~~~~~~~~~~~~~~~~~~~~~~~~~~~~~~~~~~~~~~~~~~~~~~~~
This is a link to the excel spreadsheet:
drive.google.com/file/d/1J34k...
~~~~~~~~~~~~~~~~~~~~~~~~~~~~~~~~~~~~~~~~~~~~~~~~~
This is a link to the analysis example of five-point liker scale:
drive.google.com/file/d/16_TV...  Хобби
Хобби


📌📌 For assistance with data analysis, kindly contact me via this email: datanalysis93@gmail.com or WhatsApp: +212619398603 / or follow this link wa.link/l6jvny
Facebook: facebook.com/benhima1/
Instagram: instagram.com/medbenhima2015/
Linkedin: www.linkedin.com/in/mohamed-benhima-6a1087109/
Twitter: twitter.com/Mohamed_Benhima
WhatsApp: +212619398603
E-mail: Datanalysis93@gmail.com
Zoom: us05web.zoom.us/j/5038752034?pwd=SDVjZGZXaEl5b0d2bVJ2c3M2VzVWUT09
Google Meet: meet.google.com/tgr-vmww-aoj
GoogleClassroom: classroom.google.com/c/MzI0MDc1MjM4NDI0?cjc=s2vuft2
Code: s2vuft2
Telegram Research Support Group: t.me/joinchat/FqMy6gQ-xRU6bgLg
I watched so many explanation videos but yours is the only one that truly helped me. Thank you!
Thanks a lot, DOC for the good explanation and the materials.... It is like you know exactly what we are searching for. Thank you.
Thank you so very much for this! Extremely helpful. I feel like I'm actually getting somewhere with my dissertation! Thank you!!!
Thanks so much for your detailed explanation on the Likert scale. You really made my day!
Very clear, descriptive and helpful. Thank you so much for sharing all this information!
Thank you Mohammad for your brief and informative explanation concerning the analysis of the Likert scale in SPSS. I really enjoyed it. Best wishes bro!
شكرا جزيلا اخي محمد على الشرح الواضح والمفيد تحياتي لك
Omg thank youuuu sooo muchhhh for making thissss video 😭
Thanks a lot sir!! You saved my life!!!!!
Very helpful. Thank you very much for the video
JazakhAllah Khayr Ahki
Thank you so much brother, barakallahu feek
Thank you for this!
A life savior!
Thank you for the information 🙂
Thank you so much,God bless you
Thank you so much for the easy explanation and also the link to the excel document, it is a tremendous help to me as I would not have know how to do the excel sheet otherwise
Most welcome!
Assalamu'alaikum Brother. this is really helping me, may Allah always bless you and your family. Thank you My brother. I am going to use this as method to analyze my research data.
Amin! Thank you!
Thank you very much sir 🙏🙏🙏🙏🙏 a life saver for me
Thank you so much sir
Thanks for your simple explanation. i will need the interpretation chart for mean and SD for a 4 likertscale.
Thank you very much for this!
Btw - I have another Likert scale in my dataset with following options: (1) Never, (2) Sometimes, (3) Often, (4) Very often. Do you think it is possible to follow this logic while recalculating the values so it would fit for 4 items?
Thank you! :)
Thanks for this. Note that a Likert scale is considered ordinal but usually analysed as if an interval scale!
It can be treated as a nominal as well when analysing frequencies and percentages.
Great 👍
This is the best of your likert scale videos. ❤ You know exactly what we are looking for ❤❤❤ I used to belive that calculating Mean on a likert scale was wrong until I saw some authors who argued that likert scale is on interval.
No... it is ordinal.
thank you sir
Very helpful. thanks
Glad it was helpful!
If I start the likert scale from Strongly agree to S.disagree will the interval be the same (1-1.8 for strongly agree)???
so clear
Great!
thank you
Good day! Likert scale itself is inherently not normal (Aboy, 2023). The appropriate measure of average and dispersion is Median and IQR. Median is less sensitive to outliers and skewed distributions compared to mean. IQR is less influenced by extreme values compared to SD.
Sir, when do we need parametric/non-parametric tests 9like Mann-Whitney U) for likert-scale questionnaire like this? And do we need normaility test too?
Many thanks.
Welcome 😊
How to comparing dependent an independence variable? How interpret the result
Good
Great, would you make another video on how to run a chi square test (relationship) for two variables with ordinal data (Likert scale). A case in which you have, say, 15 items for a variable (all likert items) and 16 items also likert. In SPSS OF COURSE. Thanks friend!
if possible in two ways. (one in which you turn likert into means and the other without turning the data into means.
Can you give me the intervals for 4-point likert scale?
Hello, I am an undergraduate student working on my graduation project. I will be using a Likert scale questionnaire to collect data to answer my research question. The thing is that I do not know how to analyse the data afterwards, as I have never dealt with anything such before. Would you kindly help me with this matter, if you do not mind? I need help, but I do not know anyone that I can ask. I would truly appreciate it if you agree on helping me.
How did you get the intervals?
Thank you for the vedio. Kindly explain on what basis you have put your likert scale in continuous data?
Lubke, Gitta H.; Muthen, Bengt O. (2004). Applying Multigroup Confirmatory Factor Models for Continuous Outcomes to Likert Scale Data Complicates Meaningful Group Comparisons. Structural Equation Modeling, 11, 514-534.
@@MohamedBenhimaPhD Reading the abstract of the cited paper, it is still against your video and does not answer @Pratima's question. See below:
"Treating Likert rating scale data as continuous outcomes in confirmatory factor analysis violates the assumption of multivariate normality. Given certain requirements pertaining to the number of categories, skewness, size of the factor loadings, and so forth, it seems nevertheless possible to recover true parameter values if the data stem from a single homogeneous population. It is shown that, in a multigroup context, an analysis of Likert data under the assumption of multivariate normality may distort the factor structure differently across groups. In that case, investigations of measurement invariance (MI), which are necessary for meaningful group comparisons, are problematic. Analyzing subscale scores computed from Likert items does not seem to solve the problem."
Hi, I got error message "Error message: All variables in the working file or in the sets in use are inappropriate for this dialog box" I am using the same Likert scale, my variables are defined as string cause my values in the response Excell sheet are also strings ("Strongly Disagree", "Disagree", "Neutral", "Agree", "Strongly Agree") Thank you.
if we have four point likert scale what is the intervale
I see that you didn't analyze it in seperate groups (Freshman, Juniors etc.) to get results for each group, how do you do that?
where can I download the SPSS app?
This is wrong. Likert Scale is not an interval scale. It should be ordinal.
To everyone saying Likert scale is ordinal, you can check out his reference. "An issue on whether Likert items maybe considered an
ordinal level data or an interval level data is a subject of disagreement. In most practice, they are considered ordinal or interval level data, many regard such items as ordinal data because at only five levels, one cannot assume that respondents’ perceived all pairs of adjacent levels as equidistant. On the other hand, often the wording of response levels clearly implies symmetry of response levels about a middle category; at the very least, such an item would fall between ordinal- and interval-level measurements; to treatit as merely ordinal would lose information" (Pimentel, 2010)
Thanks for sharing this information!
How to do this in excel 2007
is it really ok to get the mean of a likert scale considering the statements of your example
There is a controversy about that. But I noticed that it works
Hi Mohamed. I have a question regarding Likert. I have for „can not be assessed“ code 0. But how do I use 0 in the Interval Scale with lower limit and upper limit? Thx
You seem to be inventing the scale indeed. Participants should be welcome to omit question/s.
Thank you so much! I have a question, though. I cannot find the analysis table (1. Strongly Disagree : [1: 1.80)
2. Disagree [1.80: 2.60) and so on) in your cited article. where can I find it so as to reference it in my paper?
You can watch this video: ruclips.net/video/WoANW7maoM0/видео.html it explains the ranges in detail and it contains references for your work! Best of luck!
@@MohamedBenhimaPhD thank you :)
@@chadyfrs93 Welcome:)
hello sir, thank you for the great explanation. i have a few questions
1. do we need to do normality test for descriptive statistics?
2. my questionnaire involved 4 option which are:
1= not at all important
2= somewhat important
3= very important
4= extremely important
even if my likert scale different like this, i can still use this method right?
thank you sir for the video and I'm looking forward for your reply. 🥰
No need for normality tests for descriptive stats
@@MohamedBenhimaPhD thank you so much sir! loved ur videos 😁😁😁👍
@@MohamedBenhimaPhD sir i have one more question, do we need to correlate the dependent variable and the sociodemographic factors?
as my research, do we need to analyse between perception on Alzheimer's and the independent variable (age/gender/race etc) ?
@@nurimannajihahbintiabdulra7874 You can use a t-test or ANOVA instead, check my other videos
@@MohamedBenhimaPhD Before using t-test or ANOVA, your data should follow a bell shape, a normal distribution. These two are parametric tests. Please@Mohamed, guide the students appropriately.
I disagree with most content in this video.
1. Likert scale type is ordinal, NOT interval. It should be clearly stated that in this example, we shall assume the data as an interval. The distance between Strongly DisAgree and DisAgree is not same as the distance between DisAgree and Neutral.
2. Having an average of 3.08 does not necessarily mean that most data lies close to the Neutral position. E.g. (1+5)/2=3 or (2+4)/2=3 or (3+3)/2=3. In these examples, the average is 3 yet the two of the examples had participants with data towards the extreme ends.
3. Rather add Agree and Strongly Agree and make a conclusion such as 60% of the population are in agreement.
Otherwise, use chi-square and test the statistical significance of the differences per variable.
Some authors argue that Likert scale type is on the interval scale of measurement
@@lovinaogundeji It depend on the scale, remember one can have a 100 point scale, 10 point, 7 point etc, some 3 point, 5 point
Hi! Do you have a reference for the pointing system in interpreting the mean of the likert scale? Thank you.
yes, can I ask the reference for this too
Pimentel (2010)
@@MohamedBenhimaPhD I'm having a hard time finding this article. Do you have the citation?
@@cassandrarasmussen4421 Pimentel, J. (2010). A note on the usage of Likert Scaling for research data analysis. USM R
& D, 18, 109-112.
@@cassandrarasmussen4421 www.researchgate.net/publication/331231816_A_note_on_the_usage_of_Likert_Scaling_for_research_data_analysis
Hello thank for the tutorial
I have a problem Please
I try to evaluate thé motivation of Drinking on some participant and for it a use thé « DMQR-SF » which is a questionnary of 12 questions and each questions hav 5 items with point ( never = 1 pt, somestimzs =2 pt , half of times =3 pt, much of times =4 pt , everytimes =5 pt) , and each questions Belong to one of the 4 main reason Why thé participant drink alcohol ( expl: questions 1,5,8>social reason; question 3,6,10>Forget problem….etc at the end of questionnary we sum the point of participant in each main reason and thé main reason which has thé Highest score its thé reason Why thé participant drink alcool
Now i try to do it on SPSS, i Créate variable for each main reason , i sum , i create another variable who show me the highest score between thé 4 with command » Max « but thé way is that this last variable dont show me Where thé highest score come from…i am force to go and see thé other 4 variable to see where it comme from it really not good because i have more than 1000 participant… it will be well if you have a solution who show me where thé highest score Côme from so that injust make a fréquency table
I Hope you can help me
Thank you in advance !
Hi, is there any way we can calculate the overall mean and SD from data like above? or we need to do it manually?
Hi, there is a video on that
ruclips.net/video/Ca4lrSoea34/видео.html
What does the minimum value "1" and maximum value " 5" mean? How to interpret it
From strongly disagree 1 to strongly agree 5. It can be interpreted as follows: In case, all respondents choose agree, you find 4 as maximum value, which means the majority of the respondents agreed
can you send to me the link to install the software SPSS for free please
How about the Standard Deviation sir? How should we interpret it?
Same thoughts here
Hi. Is it good use the mean to evaluate a likert scale?
Hello
Yes, researchers use the overall mean scores of Likert scales for comparison and tests
No. Mean can only be used on data following a normal distribution. This excludes ordinal data.
Please go through this link for some pointers. T-test requires data to follow a normal distribution. Thus, it is not applicable to the data in question. Rather use One Sample Median Rank (the Wicloxon Signed Rank) stats.oarc.ucla.edu/spss/whatstat/what-statistical-analysis-should-i-usestatistical-analyses-using-spss/#1sampm
thanks. i want to ask you please how did you calculate (1.8, 2.6....) ?
It is taken from the reference in the description box
@@MohamedBenhimaPhD thank you
Thank you for the tutorial, so with this method it is possible to calculate the mean and standard deviation of categorical variables especially likert-scale data, since i heard that it is only possible to calculate the mode and median of categorical variables.
Likert scale is an ordinal scale
What’s the purpose of the standard deviation?
Standard deviation is a number used to tell how measurements for a group are spread out from the average (mean or expected value). A low standard deviation means that most of the numbers are close to the average, while a high standard deviation means that the numbers are more spread out.
@@MohamedBenhimaPhD - can you give an example sir on how to interpret it using the likert scale you provided?
For example, the SD in statement 1 is 1.210, how do you interpret that?
Thanks,, I want the word file. How can I get it?
It is in the description box: drive.google.com/file/d/16_TVEg_bKCFBIqiEedDG9vk1LpxY1JGn/view?usp=sharing
@@MohamedBenhimaPhD Thanks
Hello brother, is it possible to run AHP or Fuzzy analysis for likert scale on SPSS?
For AHP, maybe in case you have many scales and items
@@MohamedBenhimaPhD can yo help how to do so please
@@BegarvingArthur send me the files to see via datanalysis93@gmail.com
Oops, the email you provided doesn't work
@@BegarvingArthur email: datanalysis93@gmail.com or Whatsapp: +212619398603
What type of variables should it be for me to bring it at descriptives table? Mine is not appearing
It should be ordinal
@@MohamedBenhimaPhD the scale is fine Sir, but I have the variable type as string, it didnt work. Then I changed it to numeric, it didnt work even then.. would you know what mistake I might be making?
@@mariya54462 You have to check the name you gave to the variable. SPSS does not accept some characters
@@MohamedBenhimaPhD oh..could you please give an example Sir?
@@mariya54462 just search youtube and google
How can I interpret 1: strongly disagree, 2: disagree, 3: somewhat disagree, 4: somewhat agree, 5: agree, 6: strongly agree please? I didn't find any reference
The higher the mean score, the more agreement is expressed
@@MohamedBenhimaPhD thanks bro...But I need a reference for my interpretation to back it up! Can you cite any reference explaining this please? Thanks again
@@wanderlustwernweh5313 You can check Pimentel (2010) a note on Likert scale
@@MohamedBenhimaPhD Ok Bless you bro...You are doing an amazing job.
No explanation is provided by Pimentel (2010) though
This is very wrong! Likert scale is not an interval. It is an ordinal. Use non-parametric tests for hypothesis testing.
Likert scale analysis depends on your research questions, hypotheses and objectives. It can be even nominal by analysing it using frequencies and percentages. Novice researchers get confused about this.
Wrong explanation, Likert scale is an ordinal scale. It is not interval. Then, we cannot calculate the mean for ordinal scale since we don't know the difference among each values.
Thank your, sir, for the explaining this.
You can elaborate further how can do t test on it.
Yes. I completely agree with you @Lemesa. We cannot use the mean on ordinal data. @Mohamed is completely wrong. I asked him to be truthful as the explanation in the video is very wrong, especially since no assumptions were put forward and the scale is low, up to 5.
@@MohamedBenhimaPhD I am glad that you are receptive.
Please go through this link for some pointers. T-test requires data to follow a normal distribution. Thus, it is not applicable to the data in question. Rather use One Sample Median Rank (the Wicloxon Signed Rank) stats.oarc.ucla.edu/spss/whatstat/what-statistical-analysis-should-i-usestatistical-analyses-using-spss/#1sampm
@@Luckisto I know what you mean. But it is not enough to know about statistics for research. Sensitivity analysis is more prominent that the traditional approach that you have suggested about testing normality. Both parametric and non parametric tests can be run and compared regardless of the normality assumptions. Guess what the Independent Samples t test and Mann Whitney U test show similar results with regard to significance or insignificance. They both can be reported.
The purpose of the video is technical in that the method to run the test is shown. Anyways, thank you for the feedback!
Best,
Thank you sir
Welcome!
do you have the reference for the meaning of the mean for example from 1 to 1.8 it means strongly disagree?
It is in the description box
@@MohamedBenhimaPhD sorry I didnt see thank you so much!