How to analyze Likert Scale and interpret the results

HTML-код
- Опубликовано: 16 окт 2020
- 📌📌📌 For assistance with data analysis, kindly contact me via this email: datanalysis93@gmail.com or WhatsApp: +212619398603 / wa.link/l6jvny
Facebook: / benhima1
Instagram: / medbenhima2015
LinkedIn: / mohamed-benhima-6a1087109
Twitter: / mohamed_benhima
WhatsApp: +212619398603
E-mail: Datanalysis93@gmail.com
~~~~~~~~~~~~~~~~~~~~~~~~~~~~~~~~~~~~~~~~~~~~~~~~~
The link to another video on Likert Scale Analysis: • How to analyze Likert ...
~~~~~~~~~~~~~~~~~~~~~~~~~~~~~~~~~~~~~~~~~~~~~~~~~
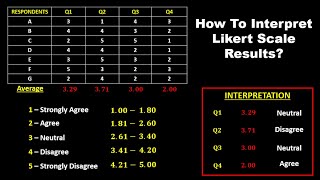
Likert scale data can be represented by frequencies, percent, and mean.
These are the three ways of representing Likert Scale Data.
~~~~~~~~~~~~~~~~~~~~~~~~~~~~~~~~~~~~~~~~~~~~~~~~~
The link to the word document: drive.google.com/file/d/197mj...
The link to the reference: drive.google.com/file/d/1JUKN...
Get customizable templates developed over eight years of research work experience:
📄✏: Customizable research templates catalogue: redev.gumroad.com/
📄✏: Likert scale survey 1: Get a Likert scale template customizable in Microsoft Office Word via: redev.gumroad.com/l/hmmwj
📄✏: Likert scale survey 2: Another short version of a five-point Likert scale in MS Word: redev.gumroad.com/l/ptsbz
📄✏: Likert scale survey 3: redev.gumroad.com/l/oxnve
📄✏: Likert scale reliability report template: redev.gumroad.com/l/jdbxdz
📄✏: Lkert scale EFA, CFA, PCA, Eigenvalue, Cronbach alpha reliability, Kaiser-Meyer-Olkin (KMO) Measure of Sampling Adequacy, Bartlett's Test of Sphericity: redev.gumroad.com/l/cynbjf
📄✏: Mediation analysis template: redev.gumroad.com/l/yeaff
📄✏: Moderation analysis template: redev.gumroad.com/l/atsdw
📄✏: Ten customizable Likert scale templates: redev.gumroad.com/l/qcamn
The link to 3, 5, and 7-point Likert scale: drive.google.com/file/d/1CV9h...  Хобби
Хобби


![Sean Rii, Karyon, Sharzkii - Taungule [My Love] (Official Visualizer)](http://i.ytimg.com/vi/eJoMuypbSzQ/mqdefault.jpg)


📌 For assistance with data analysis, kindly contact me via this email: datanalysis93@gmail.com or WhatsApp: +212619398603 / or follow this link wa.link/l6jvny
Facebook: facebook.com/benhima1/
Instagram: instagram.com/medbenhima2015/
LinkedIn: www.linkedin.com/in/mohamed-benhima-6a1087109/
Twitter: twitter.com/Mohamed_Benhima
WhatsApp: +212619398603
E-mail: Datanalysis93@gmail.com
Zoom: us05web.zoom.us/j/5038752034?pwd=SDVjZGZXaEl5b0d2bVJ2c3M2VzVWUT09
Google Meet: meet.google.com/tgr-vmww-aoj
GoogleClassroom: classroom.google.com/c/MzI0MDc1MjM4NDI0?cjc=s2vuft2
Code: s2vuft2
Get customizable templates developed over eight years of research work experience:
📄✏: Customizable research templates catalogue: redev.gumroad.com/
📄✏: Likert scale survey 1: Get a Likert scale template customizable in Microsoft Office Word via: redev.gumroad.com/l/hmmwj
📄✏: Likert scale survey 2: Another short version of a five-point Likert scale in MS Word: redev.gumroad.com/l/ptsbz
📄✏: Likert scale survey 3: redev.gumroad.com/l/oxnve
📄✏: Likert scale reliability report template: redev.gumroad.com/l/jdbxdz
📄✏: Lkert scale EFA, CFA, PCA, Eigenvalue, Cronbach alpha reliability, Kaiser-Meyer-Olkin (KMO) Measure of Sampling Adequacy, Bartlett's Test of Sphericity: redev.gumroad.com/l/cynbjf
📄✏: Mediation analysis template: redev.gumroad.com/l/yeaff
📄✏: Moderation analysis template: redev.gumroad.com/l/atsdw
📄✏: Ten customizable Likert scale templates: redev.gumroad.com/l/qcamn
Very helpful for beginners. 👍
Thank you so much for your explanations.
Thank you very much. How to interpret the standard deviation? What does it mean, here?
Hi just a quick query? You know in the variable view section under roles and you have imputed input? If you are analysing two different surveys (both likert scales) in your study do you put the independent variables under as input and the dependent variables under target ? For example I have two likert scales, one that focuses on sexism and the other that focuses on antisocial media content. My question is to what extent does online exposure to antisocial media content influence sexist attitudes? So for all the questions under the sexism survey do I list those as target as sexism is the dependent variable and then list the media content survey questions as input as they are the independent variables? Or do I leave all questions on both surveys as input? I’m only learning how to use spss at the moment.
Thanks for the video, do we use all the table or select one method only to present in the paper?
Hello I have a question regarding the Liker-Skala coding. How would you code the item "Not assessable"? With a 0? Thanks
Sir , I have collected data for PhD with the Likert scale questionnaire from three different districts in India would like to compare the data to analyse the role of Government agencies in the development of SMEs.
Hello sir, in every time I click Descriptive Statistics>Descriptive, it always says - "All variables in the working file or in variable sets in use are inappropriate for this dialog box." what should I do sir?
Sir ,,,sorry can a reserch carry most neutral answers be true research?
Ty bro great help to me
what is this test called? pls answer asap thank you
How to create a range to analyse data.like we cant interpret that this much of people are strongly agree like wise noh?
Selamunaleyküm, thank you for the video. I do have a data that ı visualized before but struggling to analyze. Likert scale used for almost every question and can use chi square since there are lotta levels and struggling to apply fishers exact test. Also I wanna learn to conduct logistic regression on them so can you please help me for a bit ? So that ı will teach someone else for good and use those knowledge in the future pleaseee :)
Really helpful sir. Thank you
Most welcome!
Sir how do we compute reliability of likert scale
Sir is their any good reference which have used Manova test for likert scale data after taking mean
once i change the data to numeric the data is deleted from data view
I used a likert scale(1 for strongly agree to 5 for for strongly disagree) to collect data, which tools should I use in statistics analysis, my research topic is an assessment of cybersecurity awareness challenges: A case study of SMEs in South Africa, my research questions are 1.what are the challenges of cybersecurity awareness in South Africa?, Are smes in south africa aware of cyber security?
For assisstance with data analysis, contact me via email: datanalysis93@gmail.com or WhatsApp: +212619398603
Thanks for the video. I will lyk to draw your attention to the descriptives statistics you performed on the data. Only mode is used to carry out the central tendency of a categorical data. Therefore mean shouldn't be used.
Thanks
It remains controversial though
Great things which u have shared with us.
Could u give interpretation for it.it will helpful .
After that we can apply one sample t test for it.
Thank you for the encouragement. Kindly check other videos on ruclips.net/video/DJtxYiXIy4U/видео.html
How to do FoMO scale analysis?
what kind of analysis do you prefer? My survey is build upon my six customer loyalty factors, with three statements for each factor (so 18 statements in total). Statements are measured with a 5-point likert scale ranging from ‘totally agree’ [5 points] to ‘totally disagree’ [1 point].
I want to analyze the difference between Chinese and Dutch culture regarding how they value customer loyalty factors.
i have both chinese and dutch respondents (both 120 respondents)
how can i analyze?
You can use independent samples t test
Sir, can i use the pearson product-moment correlation coefficient after gathering data using a likert scale for my descriptive-correlational thesis?
Hello, David. I hope you are fine! Yes, you can use correlation depending on whether or not you have a large sample or your data is normally distributed.
Best of luck!
Good effort
Thank you!
Thank you sir, question, if I have calculated the means from differents questionnaire, how can I show the significance through tukey test?
Tukey is a post hoc test. Why do you want to include it?
You follow the same procedures since you already reached Tueky test. This means you managed to conduct the other tests like ANOVA, T-Test ...
@@MohamedBenhimaPhD I used likert scale analysis to calculate the means from my questionnaires and my professors asked to show the significance through tukey. Im still new to statistics so Im a bit confused. Can you do anova with just the means and number of respondents?
@@alwayslearning1585 Honest significant difference is another name for Tukey Test
When you do anova and you find differences that are statistically significant, go for Tukey Test
Thank you sir for sharing. But I have a question, how do we analyze the likert scale variable with the dichotomous (yes/no) variable? What statistics correlation should i use?
chi-square
You saved my life. Thank you!!!
Hi i am doing a study on the effect of online learning to students’ mental health, i used a likert questionnaire to gather data, what test and analysis should i do?
It depends on your research questions and hypotheses.
My null hypothesis is that online learning has no negative effect on students’ mental health
I have been watching other people recommend Pearson r or spearman but I am not entirely sure,
If your variables are continuous, go for correlation. But check the normality of distribution to see whether you use Pearson or Spearman.
Please am presently doing project and am stuck in analysing my results..
Pls can u explain how MEAN VALUE is gotten pls
For assistance with data analysis, kindly contact me via:
Facebook: facebook.com/benhima1/
Instagram: instagram.com/medbenhima2...
Linkedin: www.linkedin.com/in/mohamed-b...
Twitter: twitter.com/Mohamed_Benhima
WhatsApp: +212619398603
E-mail: Datanalysis93@gmail.com
I have collected data for questions on adoption ( quest are based on 3 categories i.e child , adolescents and common quest for both) I have taken questions as columns and rows (data entry of various participants) as rows i.e I am using likert scale 1-5 so a row contains any value between 1-5 for 29 cols(questions) Initially I wanted to predict something like which parent should adopt a child and which should adopt a teenager , so which tests should I conduct ? I need to do this using Machine Learning , so should I go for Ordinal Regression?
Also can a ML student use SPSS or should I do it in python or R ?
Sorry for the late reply, you should check the assumptions of the model of regression so as to find the best that suits your data.
@@MohamedBenhimaPhD sir, I also have 3 demographic factors - type of parents(married/single),age and income . So based on these 3 demographic factors I want to analyze
1) Married/single responses toward the question asked
2) what age group responds how?
3) which income group is likely to agree/disagree the most or least .........basically more or less same quest for all 3 dependent variables
demographic factors would be dependent variables so I have 3 dependent (type-dichotomous (married, single),age(between 25 to 100) ,income (ordinal) and 29 independent variables(ordinal)
Do I need to do separate analysis on for all 3 dependent factors?
the 29 questions are further separeted into 3 categories 15-common , 6 for child and 8 for adolescent adoption related question
sir should I combine the 15 quest under common and likewise and make only 3 questions (i.e a summary of all common, all child related and all adolescent ,) instead of having 29 questions in my dataset?
Also which regression must I go for ?
thank you so much. Could show us how to collapse agree with strongly agree and disagreewith strongly disagree
What do you mean by collapse?
integrate them together
@@maramezina1094 Go to Transform, recode into different variables, move the scale to the box, enter a new name on the right corner, in the output variable window. Then click on change. Below click on Old and New Values. The old values 1 and 2 will have the new value 1. The undecided value will have 2. the fourth and fifth values will have the value three.
@@maramezina1094 Once you recode them. Go to the variable view and change the values 1 strongly disagree and disagree, 2 undecided and 3 agree and strongly agree
Thank you so much
My questionnaire consists of a 5 point likert scale (Always to Never) and our aim is to identify the frequency of the barriers and distractions of students they occur frequently during online class. What statistical tool should we use to analyze the data? I'm thinking of using SPSS to easily compute the data but i dont know how what test to analyze it. Can I also convert the frequency into percentage?
You can use descriptive statistics
Hey, can you explain how to analyze semantic differential scale?
It is the same. The semantic differential scale can be ordinal or interval.
@@MohamedBenhimaPhD Our research is based on PSQ3 guidelines using Likert5. Can you please help with analysis?
@@faridagul7981 WhatsApp: +212619398603
E-mail: Datanalysis93@gmail.com
I am doing a comparative study related to the skillset needed to me for a job
Study of myself......... so what all test and analysis should i do in SPSS ?
Action research, what are you comparing? There are many tests to conduct
@@MohamedBenhimaPhD Topic: Requirements for a Sales Manager in XYZ and the Skill set of a Management Student- Comparative Study
Objectives
1. cognitive ability
2. positive attitude
3. industry knowledge
4. passion and commitment
Data has collected from almost 45 respondents.
What all tests should I do ?
It depends on the hypothesis and research questions.
Obviously, you need descriptive statistics, namely frequency and percent counts. Moreover, you can do parametric or non parametric tests such as one way anova or kruskal Wallis to compare three groups, independent samples t test or Mann whitey U test to compare two groups, such as male and female groups depending on whether or not the data is normally distributed.
Is it depend upon objectives and hypothesis how we analyze likert scale questionnaire
Yes, exactly!
@@MohamedBenhimaPhDsir To know the impact of school environment on the emotional competence of higher secondary level students. Is one of the objective in my dissertation.
How i analyze school environment scale questionnaire and emotional competence scale questionnaire. Which technique will i use.
Sir , i am new to this research , if i follow these two table during data analysis is it enough for likert scale questionnaire ?
Means i can easily interpret from these two steps only right?
It depends on your research questions and hypotheses. You can watch other videos on the channel.
Sir, can i use just Likert Scale without Hypothesis for my college dissertation? Is it possible.
Research questions can be used instead of hypotheses
Yes u can thats descriptive research
How i analyse likert scale questionnaire
I have data from a survey , need assistance can you help me ? I have to score it on likert scale , then measure the correlation between groups and then test the hypothesis
contact me via datanalysis93@gmail.com or Whatsapp +212619398603
@@MohamedBenhimaPhD Thanks a lot
sir can we get some help on AMOS software, want to learn
I have just uploaded a video on that. I am going to add others. Stay tuned! Best of luck!
Sir, Likert scale is it qualitative or quantitative research???
Quantitative research
Kap data ka analysis kaise hoga?
Can you translate it into English?
I had my knowledge attitude and practice data I have taken out percentages, ranges, frequencies but now I am stuck with chi square. How to apply it with a lot of variables?
@@zubianasir7304 You can do with many times with each two variables
Like how the data is quite large... Can I do chi square for age gender and income in relation with knowledge, attitude and practice?
@@zubianasir7304 Yes but one by one