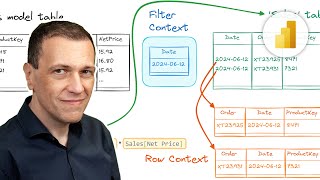
1) Row Context: Calculation is performed at each row and then aggregated. (ex: SUMX) 2) External Filter is applied first and the row context is executed. 3) Calculate overwrites filter context. Example: Calculate(sum(data[sales amount]), data[location] = "Chennai"), Here any filter applied on "location" will be overwritten by location="Chennai" for this calculated measure.
Just started learning power bi and i come across your channel. The content you provided really awesome and easy to understand even to layman. But i have question as these videos are 4 years old can we follow these videos to learn specifucally DAX or do we need to follow any latest videos to learn, could you please advise?
Your videos are amazing! I was wondering if it possible to have the link of your PowerPoint slides so we can use it has a reference when we are doing your exercises please?
Go through the playlist, so that you can be familiar with all the concepts which will help you to crack the interviews. Power BI Tutorials - Complete Playlist: ruclips.net/p/PLjNd3r1KLjQt0xN_y8F6BSIOVNvdQmq4d
Hello, I know its a stupid question, but while calculating the chennai sales , im getting 1542k sales. Did u change the dataset? Note:- I downloaded the dataset which was there in the first video.
in row context filter is applied first then calculated row by row.... in filter context calculation is done first then filter is applied.... am i right?... can anyone clarify me even more better if possible
@@AnalyticswithNags I have same understanding as above comment. Can you tell me how different is row context from filter context? In row context, filters are applied and then calculation is done row by row In filter context too filters are applied and then we aggregate the value. Can you please tell us use cases ?
@@AnalyticswithNags In the beginning of the video, there is a template already created. You haven't mentioned in your pervious videos in this series about how you created this template.


Thanks bro, tried to understand for a while now but all i had to do was watch an Indian on youtube and now i fully understand
Thanks keep learning. Subscribe this channel share this channel with friends and colleagues
Actually am just new to DAX functions.. Hope your videos would help me enhance my skill in this area.. Thanks for your valuable effort. Cheers.
Sure. Once learned practice it
@@AnalyticswithNags kindly share the dataset for practicing
Finally I understand how calculate function changes the filtering context. Thank you very much!
Thanks for your words.
Share this channel with friends and colleagues
Thank you so much for every videos Nags. Just keep going for another courses as well. I am one of your most frequent followers. Thanks again!
More content is in the way.
This is an excellent video. Thank you. This was very clear in explaining both Row and Filter Context. Excellent video.
Keep learning.
Share this channel with friends and colleagues
Thank you very much! You explained better than my university professors :)
Keep learning share this channel to your professor 😜
Awesome!!! thanks so much for explaining the different functions so well!!
You're so welcome!
Thank you, Sir. I was looking for this kinds of video. Your video explains well about what we need.
You are most welcome
Thank you... appreciate the very clear explanation.
Thanks keep learning
1) Row Context: Calculation is performed at each row and then aggregated. (ex: SUMX)
2) External Filter is applied first and the row context is executed.
3) Calculate overwrites filter context. Example: Calculate(sum(data[sales amount]), data[location] = "Chennai"), Here any filter applied on "location" will be overwritten by location="Chennai" for this calculated measure.
Hey Hii I can't understand this video could you please explain in detail
Just started learning power bi and i come across your channel. The content you provided really awesome and easy to understand even to layman. But i have question as these videos are 4 years old can we follow these videos to learn specifucally DAX or do we need to follow any latest videos to learn, could you please advise?
These videos make you beginners to pro. Follow the playlist instead of Random videos
Hi Sir, very well explained each term with examples.Thank you.
You are most welcome
You are a really good teacher! Thank you Nags!
Glad you think so!
Thank you sir for providing such amazing content 🙏
You explained this topic very well. Thanks you
Glad it was helpful!
Thanks you for making such valuable tutorials
Thanks keep learning share this channel with friends and colleagues
Finished watching
thanks , keep learning
thanks i understand for simple
perfect explained
Thank you Keep Learning
very well explained !!! Kudos
Thanks keep learning share this channel with friends and colleagues
very happy to see your video's, super sir.....
Happy to hear from you. Keep learning
Awesome explanation boss, very nice.
Many thanks, Keep Learning and Sharing.
Thanks!
Welcome!
Thank you.....
Thanks keep learning share this channel with friends and colleagues
Bro what softwares and skills I need to learn in order to become a data analyst/business analyst
Your videos are amazing! I was wondering if it possible to have the link of your PowerPoint slides so we can use it has a reference when we are doing your exercises please?
Please refer the video again. Ppt is not for sharing
very usefull
Keep watching
Great 👍🏼
Thank you 👍
hi..Mr. Nags.. Can you please send the data sheet, so that we can practice at our own.. could you
we dont maintain excel , prepare your own file like the one shown , with your own sample data.
Sir Please Provide an Excel sheet with us if possible, thank you so much for the high quality of Education and Help Superb Power BI video
Check the previous videos in the same series if not provided in the desc , its same dataset as previous video.
Excel sheet is with first video of this playlist (dax (1/50)), same sheet for all of this playlist
That's great explained
Thank you
Can I get the excel you are using for demonstrate?
hi nag great work man... can we find complete dax 50 videos set....
Check Dax playlist
@@AnalyticswithNags there are only 35 .right now u am working on them only. Thanks man for great knowledge sharing....
Can you please share the data presented during the course that we can use the same data set for practicing. Thank you
The video is for understanding. Sorry we don’t maintain the dataset
I like all your Power Bi videos. do you have any power bi interview questions series/playlist?
Go through the playlist, so that you can be familiar with all the concepts which will help you to crack the interviews. Power BI Tutorials - Complete Playlist: ruclips.net/p/PLjNd3r1KLjQt0xN_y8F6BSIOVNvdQmq4d
How your Measure give bifracted value for each category I am using the same but measure give me same value for each category. How do you do that.
You need to create relationship between sale table and product table
Hello,
I know its a stupid question, but while calculating the chennai sales , im getting 1542k sales. Did u change the dataset?
Note:- I downloaded the dataset which was there in the first video.
Yes.
sir plz provide an excel data set share Your teaching is Aws, and plz share datasets sir
Check the description. Most of the videos will have the file. If it is not available then you can use the previous video's file .
in row context filter is applied first then calculated row by row.... in filter context calculation is done first then filter is applied.... am i right?... can anyone clarify me even more better if possible
In filter context filters applied then it will calculate that is what my understanding
@@AnalyticswithNags I have same understanding as above comment. Can you tell me how different is row context from filter context?
In row context, filters are applied and then calculation is done row by row
In filter context too filters are applied and then we aggregate the value.
Can you please tell us use cases ?
Can we use =SEQUENCE, =FILTER, =UNIQUE formula in Power BI or if there is any other way to do like these formula ?
Not sure what is your question
@@AnalyticswithNags can we split amount in monthly columns in power BI ? like this video ruclips.net/video/h-hpLWwHj0Q/видео.html
can i get the dataset , so that ill be able to practics alongwith the video
Follow the DAX playlist. Check in description of the first few videos the dataset link is shared
Please let me know how you created the template.
Not sure what are you asking about templates
@@AnalyticswithNags In the beginning of the video, there is a template already created. You haven't mentioned in your pervious videos in this series about how you created this template.
kindly make telegram channel to solve the problems
Check the channel home page too right corner
chennai sales measure showing error not working.
Not sure
how to download data set
From where to download files for practice?
you can download online github.com/Microsoft/sql-server-samples/tree/master/samples/databases/adventure-works
Why my answers are coming different?
May be dataset changed. I may not upload the same dataset
@@AnalyticswithNags May be. I am also getting different total sales value i.e 4501K and in above video its 5196K