At ~ 4.30, what does the z-apha/2 mean for this example? I thought that meant 1.96 would be divided by 2? What is the purpose of the /2 above the m in this equation?
I know it's been 5 months since you posted but I am just learning this stuff and would like to shed some clarity on your question. Alpha represents the confidence interval, or, the chance that the experimental data might fall outside of the average at 95% certainty and with an alpha score of 5% or .05 that leaves you with .025 on the lower end and .025 on the higher end. This means that 5% of the samples will exhibit values within those ranges, (or rather, outside of the 95%) At 1.96, the Z-score is equal to exactly .9750, leaves you with 2.5% remaining on the high end. Or, if you will, Z-alpha/2
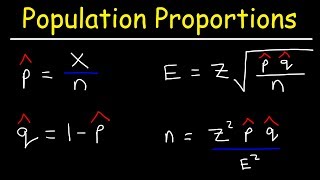
SQRT[p(1-p)/n] is the proportion standard deviation. This concept could be applied for any statistic? I could apply it to find the minimum sample size for the sample mean of a distribution for a given margin of error? x_bar is the statistic and [sample mean standard deviation]/ sqrt[n] is the error.
Thats great and very instructive but I have a question which I would really appreciate an answer to. Staying with your first example the sanple size works out at 1068. But what if my population was in fact 1068. That is to say if I had a population of 1068 to choose from and I wanted to sample from this population also with a margin of error of 0.03 and a confidence interval of 95%? Using that formula it still works out at 1068 - my whole population. So how can I adjust for poulation size?
What is the difference between the formula her and the formula np≥15 , n(1-p)≥15 ? , It is soo confusing Other question , why we are keeping using z value rather than t value , the standered devition is not known , are we shoud using t value instead ?
As far as your first question goes, they are completely different things. In this video, I look at how large the sample size needs to be in order to achieve a given margin of error. The guidelines you bring up lets us know whether or not the normal approximation is reasonable to use. They share little relation, other than they both involve the sample size. As far as the t/z question goes, that's a very good question. People who teach intro stats, myself included, typically gloss over the underlying mathematics of the t distribution (as it's well beyond the scope of a typical intro stats course). We might state that (X bar - mu)/(sigma/sqrt(n)) is standard normal, if we're sampling from a normally distributed population. Then, wave our hands a bit, and say that if we estimate sigma with s and use (X bar - mu)/(s/sqrt(n)) instead, then there will be greater uncertainty and variability, and this quantity has the t distribution with n-1 degrees of freedom. That's true, when we're sampling from a normally distributed population. But the technical details are a little more complicated. From a mathematical viewpoint, the t distribution arises if we take a standard normal random variable, and divide by the square root of an independent chi-square random variable over its degrees of freedom. That's a bit of a mouthful. It's also how the underlying mathematics works out if we're sampling from a normally distributed population. While not super complicated, this is also not trivial stuff, and it took statisticians some time to figure this out before piecing it all together in the early 20th century. But here it's a little different. The underlying population from which we are sampling isn't normal. We're sampling a bunch of 0s and 1s and taking the average. So the underlying mathematics is different, and the quantity we end up with in the end, while similar to what we've discussed before, doesn't quite have a t distribution. So the logical thought of "well, we're estimating the variance here, so we should probably be fudging a little and using a value that's a little bigger than the one from the standard normal distribution" is a pretty darn reasonable line of thinking. It's just that it doesn't quite work out to a t, from a mathematical perspective. And, in a practical sense, these are typically thought of as large sample methods so there isn't a big difference between using z or using t. I hope this helps!
@@jbstatistics @jbstatistics Thanks for much for your greet explainition For first part i completely understand it , and gound the np≥ 15 and n(1-p)≥15 is different from source to other Under the name Normal approximation of binomial distribution. For the second question withe 80% i understand what you mean Thanks .
We want the margin of error to be less than or equal to m. If, say, we want to estimate p within 0.03 with a certain level of confidence, then m is 0.03.


YES, these videos from 8 years ago are STILL VERY HELPFUL.
this is series in the BEST of all on the topic of proportion hypothesis test, Thank you!
I'm glad to be of help! Thanks for the compliment!
Thanks! these lectures really helped me to refresh my knowledge!
You are amazing. Thanks
the information you posted is very important
I'm glad to be of help!
God bless you
You can always make the complex simple!
mad respect brah
At ~ 4.30, what does the z-apha/2 mean for this example? I thought that meant 1.96 would be divided by 2? What is the purpose of the /2 above the m in this equation?
I know it's been 5 months since you posted but I am just learning this stuff and would like to shed some clarity on your question.
Alpha represents the confidence interval, or, the chance that the experimental data might fall outside of the average at 95% certainty and with an alpha score of 5% or .05 that leaves you with .025 on the lower end and .025 on the higher end. This means that 5% of the samples will exhibit values within those ranges, (or rather, outside of the 95%)
At 1.96, the Z-score is equal to exactly .9750, leaves you with 2.5% remaining on the high end.
Or, if you will, Z-alpha/2
SQRT[p(1-p)/n] is the proportion standard deviation. This concept could be applied for any statistic? I could apply it to find the minimum sample size for the sample mean of a distribution for a given margin of error? x_bar is the statistic and [sample mean standard deviation]/ sqrt[n] is the error.
same question from a guy 9 years later.
Thats great and very instructive but I have a question which I would really appreciate an answer to. Staying with your first example the sanple size works out at 1068. But what if my population was in fact 1068. That is to say if I had a population of 1068 to choose from and I wanted to sample from this population also with a margin of error of 0.03 and a confidence interval of 95%? Using that formula it still works out at 1068 - my whole population. So how can I adjust for poulation size?
thanks a ton, very clear explanation.
You are very welcome!
Great video. Keep up the good work.
Thanks!
What is the difference between the formula her and the formula np≥15 , n(1-p)≥15 ? , It is soo confusing
Other question , why we are keeping using z value rather than t value , the standered devition is not known , are we shoud using t value instead ?
As far as your first question goes, they are completely different things. In this video, I look at how large the sample size needs to be in order to achieve a given margin of error. The guidelines you bring up lets us know whether or not the normal approximation is reasonable to use. They share little relation, other than they both involve the sample size.
As far as the t/z question goes, that's a very good question. People who teach intro stats, myself included, typically gloss over the underlying mathematics of the t distribution (as it's well beyond the scope of a typical intro stats course). We might state that (X bar - mu)/(sigma/sqrt(n)) is standard normal, if we're sampling from a normally distributed population. Then, wave our hands a bit, and say that if we estimate sigma with s and use (X bar - mu)/(s/sqrt(n)) instead, then there will be greater uncertainty and variability, and this quantity has the t distribution with n-1 degrees of freedom. That's true, when we're sampling from a normally distributed population. But the technical details are a little more complicated. From a mathematical viewpoint, the t distribution arises if we take a standard normal random variable, and divide by the square root of an independent chi-square random variable over its degrees of freedom. That's a bit of a mouthful. It's also how the underlying mathematics works out if we're sampling from a normally distributed population. While not super complicated, this is also not trivial stuff, and it took statisticians some time to figure this out before piecing it all together in the early 20th century.
But here it's a little different. The underlying population from which we are sampling isn't normal. We're sampling a bunch of 0s and 1s and taking the average. So the underlying mathematics is different, and the quantity we end up with in the end, while similar to what we've discussed before, doesn't quite have a t distribution. So the logical thought of "well, we're estimating the variance here, so we should probably be fudging a little and using a value that's a little bigger than the one from the standard normal distribution" is a pretty darn reasonable line of thinking. It's just that it doesn't quite work out to a t, from a mathematical perspective. And, in a practical sense, these are typically thought of as large sample methods so there isn't a big difference between using z or using t.
I hope this helps!
@@jbstatistics
@jbstatistics
Thanks for much for your greet explainition
For first part i completely understand it , and gound the np≥ 15 and n(1-p)≥15 is different from source to other Under the name Normal approximation of binomial distribution.
For the second question withe 80% i understand what you mean
Thanks .
beautiful
Thanks!
Thank you!!!
what is m?
We want the margin of error to be less than or equal to m. If, say, we want to estimate p within 0.03 with a certain level of confidence, then m is 0.03.