Determining sample size based on confidence and margin of error | AP Statistics | Khan Academy

HTML-код
- Опубликовано: 22 авг 2024
- Courses on Khan Academy are always 100% free. Start practicing-and saving your progress-now: www.khanacadem...
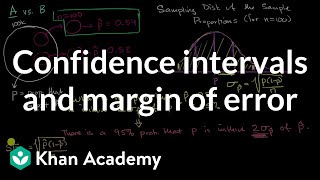
Determining sample size based on confidence level and margin of error.
View more lessons or practice this subject at www.khanacademy...
AP Statistics on Khan Academy: Meet one of our writers for AP¨_ Statistics, Jeff. A former high school teacher for 10 years in Kalamazoo, Michigan, Jeff taught Algebra 1, Geometry, Algebra 2, Introductory Statistics, and AP¨_ Statistics. Today he's hard at work creating new exercises and articles for AP¨_ Statistics.
Khan Academy is a nonprofit organization with the mission of providing a free, world-class education for anyone, anywhere. We offer quizzes, questions, instructional videos, and articles on a range of academic subjects, including math, biology, chemistry, physics, history, economics, finance, grammar, preschool learning, and more. We provide teachers with tools and data so they can help their students develop the skills, habits, and mindsets for success in school and beyond. Khan Academy has been translated into dozens of languages, and 15 million people around the globe learn on Khan Academy every month. As a 501(c)(3) nonprofit organization, we would love your help! Donate or volunteer today!
Donate here: www.khanacadem...
Volunteer here: www.khanacadem...


For people who don't know why p hat needs to be 0.5. The issue is we do not know the value of p hat before the researcher conducts the study. It could be 0.4, 0.3, or 0.01 based on the result. So if we want the margin of error to be no more than +-2%, we need to calculate the worst-case scenario in which p hat is 0.5. For reason I don't know, 0.5 * 0.5 is bigger than any other combination such as 0.4 * 0.6, 0.2 * 0.8, etc.
Let's say we use 0.4 as p hat, and we get a sample size of 1537. We use this sample size and conduct the study, and we find out the p hat is 0.5. We do not have the sample size we need which is 2401 and the margin of error is more than +-2% which is not the result we want.
The reason which you don't know may surprise you: A square has the largest rectangular area among all kinds of rectangles given a fixed circumference value.
@@qitang3813 always interesting how arithmetic and geometry can come together
@@redpotter4074 That's right my brother.
The curve of the function f(p) = p(1-p) = -p²+p is a parabola, because it is a second-degree polynomial. A parabola always has a maximum or a minimum. In the case of p(1-p), its curve has a maximum, i.e., there is a value of p which yields the maximum possible value of f(p) = p(1-p). It happens that, in every parabola of a second-degree polynomial, the point of maximum or minimum is always in the average of the roots of the polynomial. Since the roots of p(1-p) are 1 and 0, the average value, which is the point of maximum, is 0.5! Everything I told becomes clearer if you study calculus, more specifically derivative. With calculus, you can better understand, among many other things, the process of finding the maximum or minimum of polynomials. Stay safe! God bless you. =)
You can also compute the derrivative of -p^2 + p which is -2p + 1 and make it zero to get maximum resulting in p = 0.5
I didn’t learn ANY of this in class & it’s on my stats test 🤦🏻♂️ thank you !!
same bro
Why does this guy know everything
Why does p hat equal 0.5??
The confidence interval is .95 ( I doubt you need this now though, sorry :c)
Thank you for great content but the formula could have been simplified to this n=(Z^2*p*q)/E^2 (1.96^2*0.5*0.5)/.02^2 = n=2401
Does p hat 0.5 still be used even though I have a 99% level of confidence? Why or why not? I hope you could help me
Wow, this makes it so much easier. Thank you
@@heyitsbbiii Yes, if you don't know the value p, always use the .5 because that is where p hat is maximized.
confusing introduction of p=0.5. why??
p*(1-p) is maximum at p=0.5
@@sudiptasaha738 if we take p = 0.5 then the sample which we will get will not be the smallest sample size.
Please explain why we are taking 0.5 ?
We require smallest sample size
Neat trick to calculate square numbers near 50: use (a + b)^2 = a^2 + 2ab + b^2, so (50 + b)^2 equals 2500 + 100b + b^2. In this case b = -1 => 49^2 = 2500 - 100 + 1 = 2401
because we don't have P-Hat, just use N = 1 / ME^2
pick the closest answer it will be off but close
Awesome explanation! THX!
I would expect that the sample size would vary with the population size. What if the total population is less than 2,000? Thanks
Thank you so much this makes a lot more sense!!!!!
Why did you use 0.5?
You mean as large as possible.
Because a normal distribution is assumed here
Can we take margin of error 2% when confidence interval 95%?
Thanks my man you rule
Hello, does anyonw know if there is a similar way to calculate stratified sample size? (without knowing the population size for each stratum)
bruh ur a hero
Why does p hat have to be maximized? And why does .5 maximize it? Would using .5 apply to any margin of error percentage in which the p hat is unknown?
Needed this
you save meeeeee
very confusing!
what
how did get 2/196?
what if my population is lesser than 2401??
There's a different formula for a finite population
Who made the formula? what is it called?
Is this Cochrans formula?
NICE FIRST
Might be a stupid question, but is this not at all affected by the total number of all of the community members?
no
Where did you get the 1.96?
The t-table, if you look at the bottom, 95% confidence gives a z score of 1.96
you can also use your calculator menu - 5 - 5 - 3 and then put area in as .025 and leave mean to 0 and standard deviation to 1 and you will get -1.95996 which is the same thing as 1.96 according to my AP Stats teacher, hope this helps :)
please what is my samlpe size if my population is 3500
What if there's no margin of error available?
Then you'd use z*(a/2) times StDev of the square root of n to get Margin of Error.
StDev divided by the square root of n*
So, you found the sample without caring about the population size. Does it make sense to you? It sounds like pseudoscience to me.
You made a total mess out of something very simple.
n=(z alpha/2 * theta/E)squared.