FortiGate Troubleshooting - Debug Flow with Examples

HTML-код
- Опубликовано: 23 июл 2024
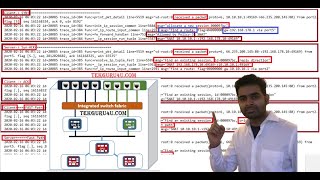
- Debug flow will help you troubleshoot the logic process the FortiGate takes when forwarding traffic.
We will go over some specifics on reading debug flow:
- Traffic direction
- Interfaces
- Routing
- Policy Matching
- Trace ID
- Session matching
- "No matching IPsec selector, drop" message
- "Allowed by Policy" message
- "reverse path check fail, drop" message
- "Denied by forward policy check (policy 0)" message
Debug Flow Command Review:
diag debug flow filter #view the current filter
diag debug flow filter clear #clear the debug flow filter
diag debug flow filter proto 1 #filter for protocol 1
diag debug flow filter addr x.x.x.x
diag debug console timestamp enable #enable timestamp in outputs
diag debug flow trace start x #how many packets to trace/debug
diag debug enable #enable the debug
diag debug disable #disable the debug
diag debug reset #reset all debug parameters (includes debug flow filter clear)
0:00 Overview
0:38 Debug Flow Filter
2:07 Example #1 - working example
4:45 Example #2 - non-working example
6:49 Example #3 - another non-working example  Наука
Наука


![Sean Rii, Karyon, Sharzkii - Taungule [My Love] (Official Music Video)](http://i.ytimg.com/vi/eJoMuypbSzQ/mqdefault.jpg)


Awesome.. Now I can start start applying this techniques on my day to day troubleshooting . I appreciate it.
Very well done tutorial with good examples to understand traffic flow and troubleshoot error messages.
Great tutorial. Thanks.
Hi, Guru. Your video content is nice and your voice to deliver the content are very accurate. Is able to "enlarge" this demo video with bigger "Font Size" since it is hard to watch/read them since the "font size" is very small!!
Hi, yes good point I've noticed this in my videos. Sometimes I finish creating the video and realize it, sorry! Will keep in mind for future videos. For existing videos, you can view in 1080p quality and fullscreen, hopefully that is a good workaround. Thanks for the feedback!
Nice ;)