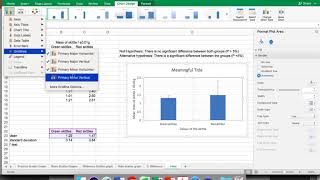
3 Types of t-tests (paired, and 2-samples with equal or unequal variances) with Excel

HTML-код
- Опубликовано: 15 апр 2020
- This video shows how to perform the 3 types of t-test, using formula and data analysis toolkit with Excel.
The 3 types of t-tests are
1. paired t-test
2. 2-samples assuming equal variances
3. 2-samples assuming unequal variances
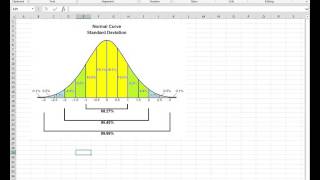
F-test for equality of variance, which can be used to decide whether the variances are equal or unequal, is also shown.  Наука
Наука


This video is spot on, very clear and simple to understand. Helped me very much! Thank you
thank you for your support
Thank you for this video, very clear explanation.
Thank you
Thanks for sharing
Thank you for this video!
my pleasure
thank you thank you thank you so much
this video is a lifesaver :)
thank you for your kind words
Excellent explanation!
Thank you
Hello sir, I am confuse... when you use the " the pairing t-test" the response are different we are talking about the same individuals responding to different subjects?
I think it is an independent sample?
wow amazing content keep it up!
thank you
Also the F critical is < F stats I think we reject the null hypothesis of equal variances ?
Put the P values = 0,09 > O.05 we should fail to reject the null hypothesis of equal variances?
It is very confusing to me can you help?
Nice topic. Keep it up.
thank you
Great educational video
thank you
V Good. thank you.
thank you
Hi, Maurice, i like your video very much, however, i tried to do the same thing for my stock prices data analysis for my master thesis, i got E in my results, thus, i cannot use the data analysis function, can you help?
Thank you!
To get "E" in your results is fine.
@@mauriceling what does that mean? How can I interpret this e? And I can’t use the data analysis function when I have this e in my result.
@@linaqin7463 (1) data is what you put INTO an analysis tool whereas result is what you get FROM an analysis tool. (2) As for "E", read this - support.microsoft.com/en-us/office/display-numbers-in-scientific-exponential-notation-f85a96c0-18a1-4249-81c3-e934cd2aae25
@9:00 nice
hi, how do we compute the DF in two sample t-test assuming unequal variance
In Excel, DFs for two sample t-test assuming unequal variances or assuming equal variances are the same; that is, df = n1 + n2 - 2
@@mauriceling df = 10+10-2 = 18. How did we get the df of 15?
@@marsch000 No idea, ask Excel since df is give by Excel and the number of observations are correct; but good point.
@10:22 wait, how do we conclude that the two samples *may* actaully have the same variances if the chances for null to be true (equal average marks for english and chinese) have one 0.09% chance? please enlighten me.
0.09 = 9%, not 0.9% or 0.09%: sorry, spoke too fast
@@mauriceling oh okay. thank you so much this helps a lot.
I still don't understand this. Can you explain further? Thank you!
@@JuneHe1 I should not take the work on your teachers / lecturers / professors. Please consult them.
Can anyone please tell how to do a t-test when you have 50 rows and 50 columns in excel spreadsheet?
Shouldn't you be using ANOVA then?
hi sir... maybe u can do a video to demonstrate a single test
I did mention in ruclips.net/video/Oz_OtfbveTk/видео.html
can you share the excel
No, sorry