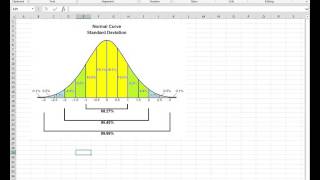
Column graphs and T tests using Excel
US
Войти
How to Do a T-Test for Beginners
19:51
Using output from t-test to graph means with error bars
8:08
Creating publication quality bar graph (with individual data points) in excel
15:25
We Took 100 Shots vs a Women's Pro Keeper and Scored ___ Goals
22:55
Seungmin "그렇게, 천천히, 우리(As we are)" | [Stray Kids : SKZ-PLAYER]
04:07
The FULL Guide To Get Fully AWAKENED Draco Race V4 (V1, V2 & V3) | Blox Fruits
14:36
Column graphs and T tests using Excel
John Power
Подписаться
105
Скачать
Готовим ссылку...
Просмотров 60 тыс.
0
0
Добавить в
Мой плейлист
Посмотреть позже
Поделиться
Поделиться
HTML-код
Размер видео:
1280 X 720
853 X 480
640 X 360
Показать панель управления
Автовоспроизведение
Автоповтор
Опубликовано: 6 янв 2025
Комментарии • 11
Следующие
Автовоспроизведение
19:51
How to Do a T-Test for Beginners
ATOMIC Teacher
Просмотров 721 тыс.
8:08
Using output from t-test to graph means with error bars
Amy Dykstra
Просмотров 27 тыс.
15:25
Creating publication quality bar graph (with individual data points) in excel
Andrew Leynes
Просмотров 112 тыс.
22:55
We Took 100 Shots vs a Women's Pro Keeper and Scored ___ Goals
ChrisMD
Просмотров 1,1 млн
04:07
Seungmin "그렇게, 천천히, 우리(As we are)" | [Stray Kids : SKZ-PLAYER]
Stray Kids
Просмотров 1,3 млн
14:36
The FULL Guide To Get Fully AWAKENED Draco Race V4 (V1, V2 & V3) | Blox Fruits
syoct
Просмотров 640 тыс.
04:13
NEW DRAGON HUNTER NPC FULL GUIDE | DRAGON HEART QUEST? | Blox Fruits...
HyperJay06
Просмотров 761 тыс.
8:35
Perform Chi-Square Test Of Independence In Excel (Including P Value!)
Steven Bradburn
Просмотров 375 тыс.
9:21
How to perform t-test in Excel
Innovative Learner (innovative_learning)
Просмотров 160 тыс.
19:09
Publication Quality Bar Graph in Excel for Research
Vivo Phys - Evan Matthews
Просмотров 181 тыс.
19:54
How To Know Which Statistical Test To Use For Hypothesis Testing
Amour Learning
Просмотров 819 тыс.
15:27
Make an Awesome Excel Dashboard in Just 15 Minutes
Kenji Explains
Просмотров 1,4 млн
7:11
How To Perform A One-Sample T-Test In Excel
Steven Bradburn
Просмотров 171 тыс.
13:28
📈 How to Make a Line Graph in Excel (Scientific Data) | multiple line graph in excel
Teaching Junction
Просмотров 158 тыс.
6:55
How to Plot a Normal Distribution (Bell Curve) in Excel - with Shading!
Maven Analytics
Просмотров 220 тыс.
7:39
Independent Samples T-Test from Only Sample Size, Mean, and Standard Deviation in Excel
Dr. Todd Grande
Просмотров 39 тыс.
1:34:32
“Хусури Ман 19” - качество оригинал 4К. Официально!
Zamonavi Media
Просмотров 2,2 млн
00:37
SPRUNKI Test IQ Challenge: Help Pinki CHOOSE THE RIGHT PORTAL
Wee Animation
Просмотров 9 млн
00:11
Газан оценивает смешные футболки
Gazan
Просмотров 155 тыс.
00:18
Ловлю рыбку!🥰 #симбочка #симба #рыбалка
Симбочка Пимпочка
Просмотров 6 млн
00:52
Плюсы беременности в Южной Корее 🤰🏻😮 #корея #беременность #дети #путешествия #shorts
Холли Лолли Live
Просмотров 601 тыс.
23:47
Я НЕ ВЕРЮ!😱 ПЕРВЫЙ В МИРЕ СКРАФТИЛ NAMELESS ФЛЕШКУ!
NAVI ТРЕНЕР
Просмотров 153 тыс.
00:59
Когда Поел на ВОКЗАЛЕ (смешное видео, приколы, юмор, поржать)
Натурал Альбертович
Просмотров 2 млн
00:12
I did not expect this to work 😭 #shorts
Junell Dominic
Просмотров 13 млн


![Seungmin "그렇게, 천천히, 우리(As we are)" | [Stray Kids : SKZ-PLAYER]](http://i.ytimg.com/vi/kAzmhLHePqU/mqdefault.jpg)


