Two-sample t test for difference of means | AP Statistics | Khan Academy
US
Войти
t-Test - Full Course - Everything you need to know
16:14
Hypothesis Testing - Difference of Two Means - Student's -Distribution & Normal Distribution
18:36
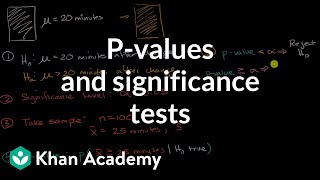
P-values and significance tests | AP Statistics | Khan Academy
7:58
I face off with MrBeast
12:26
Juice WRLD - Misfit (Official Music Video)
04:16
Fight the Holiday Spirit!
00:40
Two-sample t test for difference of means | AP Statistics | Khan Academy
Khan Academy
Подписаться
9 млн
Скачать
Готовим ссылку...
Просмотров 525 тыс.
0
0
Добавить в
Мой плейлист
Посмотреть позже
Поделиться
Поделиться
HTML-код
Размер видео:
1280 X 720
853 X 480
640 X 360
Показать панель управления
Автовоспроизведение
Автоповтор
Опубликовано: 2 дек 2024
Комментарии • 122
Следующие
Автовоспроизведение
16:14
t-Test - Full Course - Everything you need to know
DATAtab
Просмотров 368 тыс.
18:36
Hypothesis Testing - Difference of Two Means - Student's -Distribution & Normal Distribution
The Organic Chemistry Tutor
Просмотров 637 тыс.
7:58
P-values and significance tests | AP Statistics | Khan Academy
Khan Academy
Просмотров 850 тыс.
12:26
I face off with MrBeast
UR · Cristiano
Просмотров 23 млн
04:16
Juice WRLD - Misfit (Official Music Video)
JuiceWRLDVEVO
Просмотров 1,7 млн
00:40
Fight the Holiday Spirit!
Clash Royale
Просмотров 1,1 млн
15:15
Ninja Reacts to Fortnite Chapter 6 Season 1
Ninja
Просмотров 335 тыс.
11:17
T-Tests: A Matched Pair Made in Heaven: Crash Course Statistics #27
CrashCourse
Просмотров 255 тыс.
11:27
Hypothesis testing and p-values | Inferential statistics | Probability and Statistics | Khan Academy
Khan Academy
Просмотров 3 млн
30:01
All About t-Tests (one sample, independent, & paired sample)
Dr. Jacob Goodin
Просмотров 56 тыс.
19:06
Hypothesis Testing For Means small Samples Part 1
John Gomes
Просмотров 4,1 тыс.
20:56
Business Statistics Lesson 11: Two Sample Test of Hypothesis
Luther Maddy - Helping Humans Learn
Просмотров 27 тыс.
6:39
Z-statistics vs. T-statistics | Inferential statistics | Probability and Statistics | Khan Academy
Khan Academy
Просмотров 1,8 млн
9:33
Statistics in 10 minutes. Hypothesis testing, the p value, t-test, chi squared, ANOVA and more
Global Health with Greg Martin
Просмотров 8 тыс.
19:14
Hypothesis Testing EXPLAINED
Ace Tutors
Просмотров 12 тыс.
15:54
Null Hypothesis, p-Value, Statistical Significance, Type 1 Error and Type 2 Error
Stomp On Step 1
Просмотров 1,3 млн
23:44
Гиперзвуковая БРСД "Орешник": что ты такое и почему тебя все боятся?
Удивительный Мир
Просмотров 690 тыс.
21:32
Разоблачение Самой Строгой Няни в Мире!
Морковь PRO
Просмотров 679 тыс.
1:26:20
Кто Последний Выйдет Из Комнаты Получит 300.000! (Бустер, Сатир, Сабина, Горилла и др.) КУБ 4
ExileShow
Просмотров 3 млн
00:18
Magic trick REVEALED… 👀😱🤣 | Triple Charm #Shorts
Triple Charm
Просмотров 55 млн
1:14:54
Забыв телефон, хирург вернулся за ним домой. Но услышав разговор жены по видеосвязи, он застыл...
Разные Судьбы
Просмотров 165 тыс.
00:15
Oh my god! What happened? Why did everyone become an Avatar?
超人夫妇
Просмотров 2,2 млн
33:32
10 VS 50 VS 100 см ЕДЫ ЧЕЛЛЕНДЖ!
Дюшес Team
Просмотров 573 тыс.
27:46
Обзор S.T.A.L.K.E.R. 2: Heart of Chornobyl
StopGame
Просмотров 386 тыс.