Hypothesis testing and p-values | Inferential statistics | Probability and Statistics | Khan Academy

HTML-код
- Опубликовано: 21 авг 2024
- Courses on Khan Academy are always 100% free. Start practicing-and saving your progress-now: www.khanacadem...
Hypothesis Testing and P-values
Practice this yourself on Khan Academy right now: www.khanacadem...
Watch the next lesson: www.khanacadem...
Missed the previous lesson?
www.khanacadem...
Probability and statistics on Khan Academy: We dare you to go through a day in which you never consider or use probability. Did you check the weather forecast? Busted! Did you decide to go through the drive through lane vs walk in? Busted again! We are constantly creating hypotheses, making predictions, testing, and analyzing. Our lives are full of probabilities! Statistics is related to probability because much of the data we use when determining probable outcomes comes from our understanding of statistics. In these tutorials, we will cover a range of topics, some which include: independent events, dependent probability, combinatorics, hypothesis testing, descriptive statistics, random variables, probability distributions, regression, and inferential statistics. So buckle up and hop on for a wild ride. We bet you're going to be challenged AND love it!
About Khan Academy: Khan Academy is a nonprofit with a mission to provide a free, world-class education for anyone, anywhere. We believe learners of all ages should have unlimited access to free educational content they can master at their own pace. We use intelligent software, deep data analytics and intuitive user interfaces to help students and teachers around the world. Our resources cover preschool through early college education, including math, biology, chemistry, physics, economics, finance, history, grammar and more. We offer free personalized SAT test prep in partnership with the test developer, the College Board. Khan Academy has been translated into dozens of languages, and 100 million people use our platform worldwide every year. For more information, visit www.khanacademy.org, join us on Facebook or follow us on Twitter at @khanacademy. And remember, you can learn anything.
For free. For everyone. Forever. #YouCanLearnAnything
Subscribe to KhanAcademy’s Probability and Statistics channel:
/ @khanacademyprobabilit...
Subscribe to KhanAcademy: www.youtube.co...


![Kodak Black - Sharp Vibes [Official Music Video]](http://i.ytimg.com/vi/oEV0OoLJeIs/mqdefault.jpg)


I feel like you deserve my quarterly tuition more than the professors at my University. Your videos always seem to explain these topics in a fraction of the time it takes my professors, yet you still somehow manage to also explain them more thoroughly. Thanks for your help!
fr
yeah I was thinking the same thing!
- student from hopkins here
If you guys got it, how do we know when to use which formula?
Dear Khan,
So im switching between 3 statistics textbooks trying to understand the p-value, and it takes me hours and hours. Then I come here and you explain it in 11:26 minutes.
You are really kicking ass with this khan academy, or as charlie sheen would put it, you are winning.
LukSkajwokerrr
Same here 😅
@@bagiromer8587 bhai hypothesis testing nhi kr skte mujhe stats mein kuch nhi aata h
I'm a new grad student who hasn't taken a stats class in about 4 years. I'm currently in a stats class (also for learning r and spss) and was feeling lost when it came to the basics. These videos explained everything I was missing in such a digestible and understandable way! Now I'm caught up theoretically with my class and I'm getting more out of the lectures! This is fantastic content. Thanks Khan Academy!
I learned more in 12 minutes online than I did for 3 90 minute university lectures lol
tell me about it...
Bro, I feel that. I've given up watching my lectures and come straight to Khan Academy now.
Thank you Khan!
Absolutely. I don't even think that my university teachers knew that "p-value" stands for "probability value".
Me too!
Literally
Look at it this way, the null is saying that "there is no way on earth that the average is any value but 1.2 seconds." Then, assuming that is true, we do some math and figure out that if the drug indeed did have no effect, and we randomly sampled mice 100 times, it there would be a 0.3% chance that some of those mice had response times of 1.05 seconds. So it would be super improbable to get a value of 1.05 seconds. Now....rewind back to the problem. We were told that the scientist not only had mice with a response time of 1.05, but even better, that was his average response time! This means that it is crazy to think that the drug had no effect, because if it didn't there would only be a 0.3% chance we got a value of 1.05 seconds.
But that the mean of the sample would be 1.05 seems different (even less) than 0.3%, right?
eteoklos man, you should make your own set of videos. Thanks for that explanation :D
Thanks alot man!!!
It totally cleared my doubt.
Saviour u r!!!
I m ur fan nw.
Thank you so much it cleared everything.
That makes total sense. Thanks
5:18 it's not the standard "deviation" of the sample distribution but standard "error" of the sample distribution. se=s/sqrt(n)
@Nimbus : some books call it standard error of the sample mean. So in C.I, you see the sample mean +|_ z score*S.E, you do that for adjusting the error in the sample mean which gives an interval containing the pop mean with some level of confidence.
I have been searching for this comment. Thank you m8 for clarifying
old comment but THANK YOU ! I was so confused...
So in 2 more hours i'm having mathematics exam. The hypothesis says i'll fail it and will come back after 2 months to watch this video again for a resit paper. Thanks anyway.
i will reject the null hypothesis which means that your hypothesis is statistically significant and is applicable on population which include me which means that i will also fail the exam and come beck here 2 months later XD
spy 009 haha.. You'll pass don't worry.
Call your teacher instead of waiting till the last minute before the exam to learn the material
You shouldn't skip class, js.
@@ellaiyarasankalidass5699 what happened
This is amazing! Having heard about Khan Academy a million times, this is my first time watching it. This is too good and I want my tuition back
i still don't get it... damn exam is screwed
i feel u.
+Toby chua yep... and is actually a retake and im still screwed
I'm done too.
+Leo R.
This was the ONLY thing that I could not understand when I took probability and statistics. I'm just all duuurrr when it comes to this concept.
Toby Cai y
Ok, I think I figured something out. There are actually three standard deviations at work here: SD1: the SD for the 100 individual drugged rats (the SD of the sample, .5 seconds), SD2: the SD for all could-be drugged rats (the SD of the population, we don't know), and SD3: the SD for AVERAGES taken of 100 drugged rats (the sampling distribution, which here is estimated to be .05 seconds) . SD3 represents the SD you get if you take averages of 100 drugged rats, many times. The fact that you're averaging 100 at a time makes the distribution tighter, and in that light, a difference here of .15 between the null and the test result is significant. In effect, it's bigger than the distance you'd normally see between an average of 100 rats and the true average. He said SD3 is supposed to use SD2 but you can use SD1 if it's a reasonable size like 100.
Thank you I was so lost
OMG the following clarification just made starting my homework a WHOLE lot more fun!
The probability (P-Value) of getting a sample (H1) being 3%, assuming that the null hypothesis (H0) is true, suggests that we should reject the null hypothesis (H0).
So, if (P-Value) is > 5%, then we will accept H0, b/c the chances of getting (H1) are high enough.
Thanks Khan!
Was around for your original videos in undergrad many many years ago, and now that I’m back for my Masters, you’re still coming in clutch as ever. Owe you a ton.
you single-handedly got me through a-level maths alive god bless you and all of your descendants
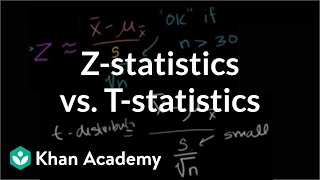
There is a mistake : The t-statistic would be much more accurate since we know nothing about real s.d. (population s.d.).
Edit : For n > 30 CLT kicks in and Z-score can be used instead of t-score even tho we don't know population sd
Ur Z test inverts the position of x-u by u-x It suposed to be Sample mean 1.05 minus Population mean 1.2 and u put Population mean 1.2 minus Sample mean 1.05.
Yess, he did. I got so confused
I still don't get it.. fuck..
You and 72 others. The narrator neglected to define many terms, and he used lots of jargon.
kimaegaii I'm with you bro
Yue Zhang
thank you man, i thought i was the only one for a minute lol
*****
Thank you Rafsan!
There are three standard deviations he is talking about: the std of sampling distribution (of the mean) "\simga_{\bar{x}}" , the std of entire population distribution "\sigma" and sample std "s". (1) When the number of examples in a sample is large, "s" will be very close to "\sigma". This is pretty easy to understand, more sampling, closer to the true distribution. (2) "\simga_{\bar{x}}" means another thing, 100 examples as a sample, we compute the mean of these 100 examples; then we take another 100 examples and compute the mean; we do a lot of times; we compute the std of these means, this will be the std of sampling distribution of the mean. This is what he wants to compute and his computation is correct. (3) why computing "\simga_{\bar{x}}"? because all from beginning, all he compute is the mean. 1.2 is the mean, 1.05 is the mean. He tries to determinate how 1.05 is from 1.2. And the distribution of the mean is also a Gaussian distribution but with a smaller std, which we didn't at first but we can compute it by the formula given in the video, so it's 0.5 / sqrt(100) = 0.05. (4) why 0.03 not 0.015? I think it's because the hypothesis here is u != 1.2, not u < 1.2. So the extreme situation like getting 1.05 has the same probability as getting 1.35. Hope this helps.
p-value for Z score of negative 3 (-3) is 0.0013, which is less than alpha (significance level = 0.05 for 95% confidence), hence we Reject H0 null hypothesis. Another way is that the probability that the observed sample mean 1.05s being -3 Z scores away is less than 0.05 (5%) .13% here, hence Reject Null hypothesis.
Do you have to consider the fact that it is a two-tailed test and therefore use .26% instead of .13%? ( I know it doesn't affect the rejection of H0 but still useful to know)
ps: exam on Monday I beg you, answer me fast lol ^^
0:38 This made me kind of smile.
Z = (Xbar - Mu) / [SDV / sq.rt(n)]
He made the error of subtracting Xbar FROM Mu. He needs to reverse the two numbers for the correct formula. Z = (1.05 - 1.02) / [ 0.05 / sqrt(100)]
It doesn't make a difference. A z score of -3 would give the same probability of three standard deviations in either direction from the mean.
No he did 1.2 - 1.05 which is correct
@@BurgoYT no, its incorrect because the formula is (sample mean-population). it should be 1.05-1.2
why does statistics exist.huhuhu
After 5 years, i will ask the same queation, why?????!!!
@@raulecreuset4558 After 3 months, I will ask the same question, why?????!!!
so that people like you can get video recommendations like this one and others that you enjoy.
So we can have plandemics
:(
I have a final on this in 5 hours. It's 2 AM right now. Shout outs.
Yup in the same situation
What is the sample standard deviation?
Why don't we use it as a standard deviation for the sampling distribution but as a standard deviation for the whole population?
Why did you divide the sample standard deviation by 10 instead of multiplying it by 10 to obtain the population standard deviation just as the reverse of the formula says?
I am confused too. I thought .5 was the sample std dev and the pop std dev would be .5*10 = 5
He was calculating the standard error not the standard deviation..
@@femidaelettil1002 It still doesn't make any sense, the formula for the standard error is the same. se=s/sqrt(n), it should be .5*10 = 5. Plus, if you take the "approximated standard deviation of the population" that he got it's not equal to the sample standard deviation. Se = 0.05/sqrt(100) -> 0.005. Can someone explain it to me?
Late but 0.5 is not the standard deviation of the sampling distribution, it is just a standard deviation for sample with sample size of 100.
@@yuzhe6054 thank you
that blue color is so cool
+Stan Land LMFAO XD
This always helps me: "If the p is low, the null must go". which means, if the p-val is less the significance level(alpha), then you reject the null hypothesis.
Thank you sir for this 😂 slogan. I am taking my Ap stats exam today 😊1
Wait, (1.2 - 1.05)/0.05 is NOT the z-score. It is the t-statistic because the we have estimated the standard error using the sample SD in place of sigma (the population SD), which is not given.
onthe verge The sample is large enough hence you use a Z-stat
he had something like >30 samples so the two is same at this piont
shouldn't it be 1.05-1.2 ??
normally it should, but he said he wanted a positive result.
same thing relax
I was wondering the same :D
The question is left tailed from the mean. I think p value is 0.03/2 for left tail value. Actual-observed is negative side area. I could be wrong but that's what I'm thinking.
I was thinking the same thing!
You do not understand how grateful I am to you.
Thank you so much.
I know that drug. He is right, it does have a lot of effect. Yeah.
hahaha
Why do hypothesis testing when you can do drug testing 😂
machine learnig on its way ...lol
looll
Bruh.
I just had a moment of enlightenment 💡 :
“ what is the probability that we would get these results (as in the drug has no effect) in our sample?
In other words, if that probability is very very small, then the null hypothesis probably isn’t true”.
Wow. What a game changer.
Keep in mind that the p-value isnt the probability that the null hypothesis is true/false.
It's the probability of reproducing the results obtained if we assume hypothetically that the null hypothesis IS true.
But why 0.5 is considered population standard deviation in the calculation? I though 0.5 is the sample deviation????
I don't get that too, he says since sample size is large enough, we can assume population standard deviation is almost equal to sample standard deviation.
Because if the sample size is greater than 30 we assume them to be equal
@@iansequeira3352 Then why is he recalculating the standard deviation when we can assume it to be 0.5?
@@zhen3356 0.5 is the standard deviation of samples, and we are calculating standard error of the mean
The 99.7% number comes from a basic rule in statistics (see "the 68-95-99.7 rule" on Wikipedia). It's a shorthand, a useful heuristic when working with SDs.
- Assume that the underlying population's response time of the injected rats is equal to 1.2 seconds.
- Construct the sampling distribution with expectation = 1.2 seconds.
- Calculate the z-score of the observed sample mean
- If z > cutoff value, then we reject that the underlying population's expectation of the injected rats = 1.2.
- Given that, it implies that the drug has an effect on the response time with 95% confidence. But there is still a chance that the actual mean of the underlying distribution is 1.2, but the sample we got is very extreme. And we got that extreme value due to randomness of sampling.
Omg this makes sooooo much more sense now
Gonna go to sleep now and give it a try tomorrow with homework questions
Best video for hypothesis testing! Universities should play this video rather than teaching hours of lectures. They will save time and money
There's something about how this guy repeats certain key steps once or twice that just really helps me keep up with the lesson. ADHD is a b*tch.
At 49, in 2023, this is so helpful. Thank you Khan Accademy and the teacher with that calm voice who explained it so nicely.
This...makes so much more sense. You just saved me from my stats final, thank you
What is the difference between standard deviation of sampling distribution (sigma xbar) and sample standard deviation (s)? A detailed explanation would be appreciated. 4:54
5:18 it's not the standard "deviation" of the sample distribution but standard "error" of the sample distribution. se=s/sqrt(n)
Think in terms of probability distributions. When we assume that the null hypothesis is true we are saying that the new observation came from the same probability distribution as the null hypothesis. Then with this assumption we calculate the probability of the new observation from null hypothesis' distribution. If it is very little (normally less than 5%) we say that this new observation is very unlikely to be from the same distribution as the null hypothesis and we reject it. Hope this helps others who are watching this.
4:15 why are we calculating the standard deviation of sampling distribution when it's already given in question as 0.5 seconds?? what's that 0.5 seconds?
this the best method of evaluating a null hypothesis, no need to refer to any table, amazing.
Currently doing the CFA Level 1. This was so helpful. Thank you
This is just incredibly awesome stuffs. Iam a medical student at Melbourne uni Australia. I felt maths soo hard when I was a kid, if I had gone through these stuffs I think I would have been the best student. Keep up the good work, hats off to you. You will get the reward from Allah. May Allah bless you.
The assumptions of using z test are that first population is normally distributed and second the population standard deviation is known(not the sample standard deviation).
If you're wondering why he accepted the alternative hypothesis, it is because the event 1.05 so unlikely to happen (assuming there's no effect of the drug), actually turned out to happen. There's only a reason for that, that actually 1.05 isn't as unlikely to happen as it is if it turned out to happen. Think about it, if I took a good sample, how's it that I got an improbable number (within the mean distribution of the null hypothesis)? Well, because that number I got isn't improbable after all.
Sidenote: with an alfa of 5% we say we already consider 1 in a 20 shot being very unlikely. With an alfa of 1% that would be 1 in a 100 shot. So if some number inside this region which is very unlikely to happen actually turns out to happen then that's rather mysterious.
Khan, you seriously rock. Never understood p-values from my professor, but I definitely do now!
Easy way to remember:
P = Probability of null hypothesis is true, which is => u = 1.2 being true.
Since P value calculated is small = only 0.03 (0.3 %) of samples taken from population will actually have u =1.2.
This means u is not equal to 1.2 in 99.7% of samples taken from population. Therefore we reject null hypothesis since it's only true in 0.3% of samples taken from population.
shouldn't the p value be equal to 0.003/2 since our sample value is on the left side ?
first channel I ever followed on RUclips (since 2011, I think). Sal has never disappointed me.
seems smoothe but why would sampled standard deviation of the sampled poulation need to be divided by square root of sampling size instead of using the given standard deviation itself. 4:25
+debendra gurung he was looking for the standard deviation for the population by using the sample's deviation and size.
I think Kinda got it. But I lost it again. Is it because taking larger sample will give us more Normal distribution. And that dividing it by square root of sample size will at least try and reflect the SD. of the population. What a cheat way to do....
this actually is crap. I dont get it too. the question fucking says mean response time for 100 injected hairy ass rats is 1.05 with sample standard deviation of 0.5 . And then again Mr.Khan academy says the freaking sample standard deviation can be divided by square fucking root of the sample size to estimate population standard deviation. Moreover, the ass smelling rats without injections are taken in for normal distribution table to estimate z score. I am lost. Fuck me and call me hobo.
after going through all the central limit theorem and the simulations, i finally get it. the standard deviation of the population divided by square root of sample size actually approximaates the s.d of sample means of the sampling distribution otherwise notoriously known as the standard error. What a brain load of concepts.
It doesn't make sense to me. With a sample S.D. of .5 and a sample of 100, he gets a population S.D. of .05. That means we're assuming the population has much less deviation--1/10th the deviation--than what we see in the sample. But if the sample were 1000, then we'd be assuming even less yet, and with a sample of 10,000 we'd be assuming that the population S.D. was 1/1000 (!) of the S.D. of the sample. That seems like it can't be right. At 10,000 the sample should very closely reflect the population in basically all respects. How can it be reasonable then to estimate that the S.D. for the population is 1/1000 of what we see? The explanation also didn't sound right to me; you have the S.D. for the sample, and that isn't good enough to use for the population, but then you are substituting the S.D. for the sample into a formula that sounded like it was meant for the population S.D. What I've learned about stats suggests the S.D. for the population should be assumed to be bigger than what you get when you just look at a sample. I know I'm mixing up concepts, but this formula suggests the standard deviation for the population is much smaller than what you get by looking at a sample. Anyway, I still have to learn this material, and I'm sure I don't understand it yet, but it seems like it can't entirely be right...
Hey man at the Zstat calculation its should of been (1.05 - 1.2)/0.05 instead of (1.2 - 1.05)/0.05.. Sample mean - Population mean.
+lnhaleExhale90 I thought that as well. Are we wrong or is he wrong??
+lnhaleExhale90 1.05 is the sample mean
+Calvin Leung 1.05 is the sample mean
It's always population mean minus sample mean
He just wants to give a positive number(or sd)
For the first time in years I really understood the meaning of p-value hahahaha
@5:14 he says "std dev of sampling distribution" it should be "std dev of sample MEAN distribution"
I don't get it though, with central limit theorem, you take the std dev of the distribution of sample means to be sigma/sqrt(n), where sigma is the population std dev, then when you look at the bell curve, you have z = [x- mu] / [sigma/sqrt(n)].
But... in the question, it explicitly tells you the std dev of the sample times is 0.5 seconds, so why not just use that when you get to the bell curve and use z =
[x - mu] / 0.5?
I don't think I'm the only one who thinks something is wrong here.
@@colinjava8447 okay, so for the formula you need the std dev of the distribution of sample means, but in the ques 0.5 is the std dev of the sample taken for the experiment itself. It's like when 100 rats' reaction time was measured, he found 0.5sec was the std dev of that sample.
Now we need to calculate what would be the std dev of the distribution made by the means of such infinite samples, we have central limit theorem for that.
In that theorem, we need population std dev which was approximated as sample std dev.
I hope this helps.
@@adityachauhan1209 Thanks, so I'm basically confusing the std dev of the sample with that of the std dev of sample means?
And we can take the population and sample std devs to be the same thing, since in reality we wouldn't know the population std dev?
Thanks
@@colinjava8447 Yes for the first statement.
Yes for second as well with a condition that sample size is large..
@@adityachauhan1209 Thanks for the clarification
Yes! Thank you!
why is the alternative hypothesis μ ≠ 1.2 and not μ < 1.2? Seems like the test should be whether response time is reduced, not whether the response time is changed.
In just 11 mns, all the picture is really astonishingly clear enough to understand this part of inferential statistics. Thanks.
Hi - What he is saying is this 1) For most of us ordinary folks, we would think that since 2 is less than 3; or 3 is less than 6; so this is the end of it 2) but while 1.2 is greater than 1.05 in general, you CANNOT say that 1.2 is greater than 1.05 in this video 3) I am not pulling your leg(s) - this is because these two numbers (1.2 and 1.05) are not individual data such as height of two men or weight of two boys etc. These are averages from two different distributions 4) thus it is quite possible that my 1.05 number is fake news - i.e. it was obtained by luck. If I do it AGAIN on 100 rats I might get 1.25 or 1.22 etc 5) So now we are into probability - we cannot say if 1.05 is really correct or not 6) but we can say one thing - 1.05 is more than 3 SD away from the population mean 7) therefore we can say 1.05 is "different" from 1.20 but again not 100% but 99.7% of times! There is still a small chance this might be fake news but the chances are very slim - and we can even say how slim 8) Finally note that two "parameters" (sorry for this jargon) make so much impact here - one the SD of our sample and second size of our sample - now if our size increases from 100 to 100,00 you can see the number 0.05 will get even smaller! This means that our results will be even more true (guess why?) Similarly if the SD of my sample changes my results will change (why)? I leave these for you.
I hope this makes some sense. Read it again. And bless SAL. Regards - Dr Aamir
Man, this explanation completely blows my online lecture out of the water. You need to set up a contract with Pearson immediately so you can replace their god-awful video lectures with videos like this. Thanks a million!
I want to give this dude a hug!
Stats is definitely one subject you can't cram. It takes time to fully understand. And one piece builds on the next.
i don't think this matters much. the z-value is to calculate the number of std dev the x-bar is from the mean. in the video, he calculated z to be 3 std dev (where you guys think should be -3, if x-bar minus mu) (look at 8:08 in the video). negative 3 means x-bar is 3 std dev below mu, which we know because 1.05 is less than 1.2. as long as we know how to locate z in the "bell curve", we should be fine. hope this clears things up :)
I love Khan Academy and think Sal Khan is a hero. If only more teachers could explain concepts the way he can! Maybe he should do a series on 'how to be a better teacher' :-)
9:29 did he burb haha? I love this guy
If the probability of finding a reaction time of 1.05 seconds is low (0.03%) then there is little variability to be accounted for. So, when introducing the independent variable (in this case, the drug), you can say that the drug was effective ALONE because there was little variability to begin with.
I did not get why we should reject the H0 if the P-value
I'm so glad I found this channel & wished I knew about it during my undergrad yrs. I am currently preparing for a quiz & I think I can say I got this.
The most important phrase in explanation. "What is the probability of getting mean of 1.05 by ""Chance""?" @ 8:02. If you miss that everything will go bouncers.
Khan Academy, Khan Academy, what would I do without you...
THANK YOU!!!!
I was struggling to grasp this concept in a practical sense, and your video helped me connect the dots.
For those of you who are confused, P value is the probability that the data from a given sample is not due to the changes made or external influences. In other words, if the null hypothesis was correct, we would end up with a large probability that the sample mean would still be possible without any external influences i.e. injecting rats in this case. A smaller P value means greater confidence that the results were due to the external factors.
To all of you not getting this video, you need some background knowledge about how the normal distribution relates to probability, and what it means by terms like "real mean", "sample mean", "standard deviation", and "standard deviation of the mean", etc.
Yes, you're right. I'm not sure about real life practical usage for the distribution. But for studies, I believe you're allowed to take Z to approximate T when there's a large sample size as known as large degree of freedom. So, the video is in fact correct... so Imran comment might be misleading.
man , he explained so clear!!!
for those who dont understand , go improve ur basic in probability
From previous videos, I understood Sample Std.Dev = Population SD/ Sqrt(n). We have sample SD of 0.5, then pop SD should be 0.5xsqrt(100), right? In this example you are considering population SD as 0.05? Also I believed SD of sample is always lesser than SD of entire population..? please some clariy
No, the sample std. deviation isn't equal to Population SD/sqrt(n).. The standard error is.. If the samples were provided, you could find approximately the standard error by splitting the 100 samples into 20 samples group with 5 samples in each(for example), take the mean of every sample group and build a new distribution with the means. The standard deviation of this new distribution is the standard error, that would be approximately equal to Population SD/sqrt(n).
The greater the number of samples, the more you approximate it's SD from the Population SD. He has considered 100 samples enough (Usually, you can consider it if the sample size is greater than 30).
Late but 0.5 is not the standard deviation of the sampling distribution, it is just a standard deviation for sample with sample size of 100.
- Yu Zhe answer
@89Fad z-stat can also be used as long as the sample size is bigger than 30 (n>30). but of course the result from z-stat is only APPROXIMATE value whereby t-stat will give a more accurate result.
because that is the standard deviation of the sample, not your sample mean. The standard deviation for the sampling distribution of the sample will be s/√n.
THANK YOU. i didn't get this in class just today. Pro. gave the formula without the details behind those simple formulas as z-score. Now it's very intuitive to have the x subtracted from mean and then divided by the sample standard deviation. so make sense now.
To calculate the 'sample' standard deviation, you do the S.D(sample distribution) = S.D(population)/sqrt(sample size)
Was looking for this , thanks.
Agreed that when the sample standard deviation is used, then basic consideration goes to the t distribution, however, in samples that =or exceed 30 then the t distribution approximates the normal distribution. So he is usually an approximate z or normal distribution.
I don't understand when we need the sample standard deviation (4:13), why you take the standard error of the mean insted the (0.5) that is given previously :(
TheJalerking i don’t understand it either
If you are using the sample size standard deviation don't we use a T value?
Great explanation but wouldn't the probability of getting this result be less than 0.15% (or 0.0015)? Is anyone else confused about this?
"thats wrong because the H1 only states that the mean does not equal 1.2. If it said that the sample mean will be either lesser or greater, then it would be a single tailed analysis. But in this case, it is two-tailed."
Just copy+pasting what @Nikatronixx wrote on Alex Vech's comments.
@@pedroluizb I think the probability of getting that 1.05 sec is still the area under left tail. So it should be 0.15%? still confused.
If the question was "do you think that the drug lowers response time?" then we would be looking at 0.0015 under the left tail. The "an effect" part of the question, though, means that our inquiry is more spread out.
Maybe it's like someone asking "does your car do anything unusual?" If you answer "yes" and think to yourself "but of course it does Something unusual, most cars do" and then the other person asks "is one of the windscreen wipers on constantly?" and you say "yes!" you would think to yourself "how did they know? It's so specific/unlikely". The probability of any unlikely event is higher than a specific unlikely event, so the 0.3% vs 0.15%.
Spring09 i think it would be .3%. you would be correct if he was saying Mu < 1.2, but since is says not equal to then it means a two sided distribution
10:00 GUYS! He's going to reject!
Very nicely explained! It's one of the most important concept in Data Science and Machine Learning! Thanks team! :)
"I'm not 100% sure..."
no, but you're 99.7% sure.
I was about to break down because my teacher makes things so complicated THANK YOU
0:38
Good explanation, but a warning for students:
* He computed the T-value, not the Z-value. This is due to the fact that he *estimates* the std. dev. If however, we "somehow" knew the population's std deviation, then this indeed would be the Z-value. Practically speaking, we almost never know the "true" standard deviation of a population and hence the Z-value, comparatively, is less useful.
* He uses a Gaussian/Normal distribution, when in fact, he should use the T-distribution
I'm trying so hard to understand the "why" behind all this stuff but I'm not getting it.
But basically, if it helps anyone, if your P value is LESS than 0.05, then you can reject the null hypothesis, which is statistically significant (all statistically significant means is you rejected the null hypothesis).
+No7oriouSx well it depends if it two or one tailed test
Wish I had found these sooner, I struggled so bad with econometrics. You make things so easy to understand.
Because in the problem, the actual question asked if you believe the drug HAD AN EFFECT on the response time. It did not ask if you believed it caused the response time to DECREASE, even though it did indeed have a lower mean. You have to look at what the question is actually asking.
This is a single sample t-test and not a z test because you used the sample standard deviation and not the population standard deviation to calculate the estimated standard error of the mean. If you have the population standard deviation then you can do a z score but if you don't know that then you do a t-test using the sample standard deviation.
I'm the only comment from this year you will see.
R u still breathing
@@Swift326x some days are better than others
@@dannydeko331 I hope u finished school as I'm just starting 💖all my hugs dear stranger
@@Swift326x still got one more year. Good luck to you.
The man just has a talent for explaining things.
No, it's just that if it's more than 30, the t-distribution is close enough to normal that it doesn't really matter which one you use.
Thanks for this. 4:37 you mention, because we have a nice sample size. Questions related to this:
1) What determines the right sample size in this case?
2) What if didn't have a nice sample size? How would we estimate the standard deviation of the population?
3) Am I right in assuming that you also estimated the sample mean for the same reason that the sample size is sufficient?
Could anyone please answer?
As others have noted, isn't the formula: Z= sample mean minus population mean divided by population standard deviation divided by sample size squared. 1.05-1.20/ .05 which is -3. I think this has been noted, but should be changed in the video, because as it is the same result, I don't think this would be in a one-tiered test. I think this mistake could be a good way to better explain p-value.
Exam in 1.5 hours and haven't even read this topic yet (lol)... Understood with this video. THANK YOU!!!
Studying for stats exam
Option 1. Watch video lectures from the uni.
Option 2. Watch Khan Academy videos.
I think we all know the best option.
It may be incorrect, but yours isnt right either. for a two tailed test, the pvalue is 2*P(z