Это видео недоступно.
Сожалеем об этом.
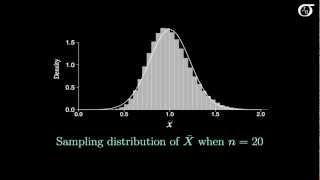
The Sampling Distribution of the Sample Proportion

HTML-код
- Опубликовано: 9 май 2014
- A discussion of the sampling distribution of the sample proportion. I discuss how the distribution of the sample proportion is related to the binomial distribution, discuss its mean and variance, and illustrate that the sample proportion is approximately normally distributed for large sample sizes.


The best explanation I have watched on RUclips very clear and precise, well done presentation.
You have a great narrative voice. And you teach very well. Thanks.
I should be paying part of my school tuition to you! Thanks to you I am more than 100% prepared for my exam!
This video brought out a concept that the textbook did not. That is, how values of p close to 0 or 1 show skewness for smaller sample sizes compared to p=0.5. Excellent!
I hope you can come and teach at my college. You are well paced, without a monotone voice, and explain things so well.
Extremely well explained. Congrats! Couldn't be any better.
+Why Google, why? Thanks!
I like the way you deduce the standard deviation, make so much sense
I'm glad to be of help!
brilliant expose, could not be better
I finally finally understood this. Thank you! :)
You are very welcome Darlene. I'm glad I could help!
I too just one day before final stats exam 😂 lol thanks thanks thanks!!!!!!
awesome video! Thank you!
You helped a 9th grade student. Congrats you're a genius!!
9th grade? gosh, so early
@@JoaoVitorBRgomes probably lives in a wealthy school district or is attending a college prep school
Thank you so much for this!
What distribution p-hat follows without normal approximation? Since p-hat is just a linear transformation of RV X (X following binomial distribution), what distribution transformed RV follows? We will need that when normal approximation is not appropriate.
awesome video!
Thanks!
The goat, thank you
Very helpful video
employees in a factory can be divided into 3 strata according to department and asked attitudinal question which were to answer yes or n. it was suspected that there may be large differences for survey variables, a sample mean of employees were selected from each department and each individual answered YES or NO. we want to computed the sample mean proportion, variance and the standard error of the mean.
what are you going to do
Good explanation, thanks
You're welcome!
Rip to everyone cramming for methods externals 👁💧👄💧👁
What is sample size in this context? Is it number of observations in a sample or the number of samples?
Whenever I use the term "sample size", I am referring to the number of observations in the sample.
Thank you!
I think we all owe you a beer.
Thanks...
9:29 leads to the summary
thank you so much xxxx
You are very welcome!
thanks
THANK YOU!!!
You are welcome!
goooo year 12 methods gals
hi, your video is very informative and clear. but can you please explain what factor/factors makes the sampling distribution of p-hat approximately normal when n gets really big given a quite small or big value of p.
+Shawn Wu its the concept of central limit theorem
robotic zane boy thanks
why do we need to sqare n @3:40
When a random variable is multiplied by a constant, the variance gets multiplied by the square of the constant. It comes out pretty quickly in the math: Var(cX) = E[(cX - mu_cX)^2] = E[(cX - c*mu_X)^2] = E[c^2(X - mu_X)^2] = c^2E[(X - mu_X)^2] = c^2 Var(X). (Yes, there are some steps here that would also require explanation/proof.)
Am from mzumbe universty i like
Marky Mark
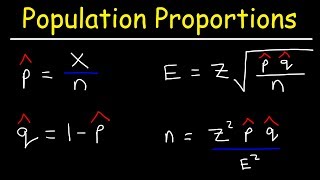
Sample proportion
Does the sampling distribution of proportions normally distributed?✨
if they are large enough
2:40
jbstats FTW
can u please use smaller words.... my ADD ass cannot keep up...
I know this was 4 years ago but this is such a huge fucking mood
chu good luck hero
Sage Delphi thanks, math makes me want to neck myself