Sampling Distributions: Introduction to the Concept
US
Войти
Introduction to the Central Limit Theorem
13:14
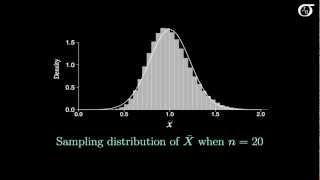
The Sampling Distribution of the Sample Mean
11:40
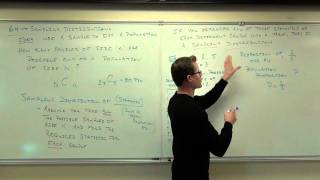
Statistics Lecture 6.4: Sampling Distributions Statistics. Using Samples to Approx. Populations
50:21
How Employees Are Coffee Badging To Avoid Full Days At The Office
11:24
Demetrious Johnson Trains w/ KHABIB & ISLAM MAKHACHEV! | EXCLUSIVE FOOTAGE!
43:59
BABYMONSTER - 'Love In My Heart' M/V
03:52
Sampling Distributions: Introduction to the Concept
jbstatistics
Подписаться
215 тыс.
Скачать
Готовим ссылку...
Просмотров 316 тыс.
0
0
Добавить в
Мой плейлист
Посмотреть позже
Поделиться
Поделиться
HTML-код
Размер видео:
1280 X 720
853 X 480
640 X 360
Показать панель управления
Автовоспроизведение
Автоповтор
Опубликовано: 27 янв 2025
Комментарии • 114
Следующие
Автовоспроизведение
13:14
Introduction to the Central Limit Theorem
jbstatistics
Просмотров 585 тыс.
11:40
The Sampling Distribution of the Sample Mean
jbstatistics
Просмотров 320 тыс.
50:21
Statistics Lecture 6.4: Sampling Distributions Statistics. Using Samples to Approx. Populations
Professor Leonard
Просмотров 187 тыс.
11:24
How Employees Are Coffee Badging To Avoid Full Days At The Office
CNBC
Просмотров 1,2 млн
43:59
Demetrious Johnson Trains w/ KHABIB & ISLAM MAKHACHEV! | EXCLUSIVE FOOTAGE!
Mighty
Просмотров 2,4 млн
03:52
BABYMONSTER - 'Love In My Heart' M/V
BABYMONSTER
Просмотров 11 млн
02:46
BLACK BAG - Official Trailer [HD] - Only in Theaters March 14
Focus Features
Просмотров 2 млн
50:40
AP Statistics Unit 5 Summary Review Video - Sampling Distributions
Michael Porinchak
Просмотров 27 тыс.
6:42
Introduction to Confidence Intervals
jbstatistics
Просмотров 391 тыс.
11:06
Sampling Distributions (7.2)
Simple Learning Pro
Просмотров 305 тыс.
1:01:09
Central Limit Theorem - Sampling Distribution of Sample Means - Stats & Probability
The Organic Chemistry Tutor
Просмотров 876 тыс.
9:03
An Introduction to the Poisson Distribution
jbstatistics
Просмотров 1,4 млн
21:40
Statistics 101: Sample Proportions
Brandon Foltz
Просмотров 46 тыс.
14:11
An Introduction to the Binomial Distribution
jbstatistics
Просмотров 751 тыс.
1:34:58
Колумбия: внутри самого опасного картеля / Перестр**лки, про**титуция, банды Медельина @anton_lyadov
The Люди
Просмотров 265 тыс.
20:13
DOTA 2 - АДСКОЕ МЕСТО!
Di ray
Просмотров 157 тыс.
46:13
Я нашел спорткар МЕЧТЫ и это изменило все!
Чердак
Просмотров 480 тыс.
01:11
Довел курьера до истерики 😱 #тнт #shorts #юмор #шоу #однаждывроссии #дорохов #данияр #доставка
ОВР Шоу
Просмотров 204 тыс.
00:40
Поиграли в такую игру кальмара? #roblox #игра #смешное #интересное #роблокс
D1NAZ02
Просмотров 66 тыс.
01:00
И если вы не знали, то голод во многих странах продолжается…
Mikhail Boldurev
Просмотров 201 тыс.
27:23
Потери России: сколько своих солдат и корейцев Кремль положил в Курской области | Донбасс Реалии
Радіо Свобода
Просмотров 453 тыс.
00:19
Тест на интелект - Minecraft Roblox
ЛогикЛаб #2
Просмотров 192 тыс.


![BLACK BAG - Official Trailer [HD] - Only in Theaters March 14](http://i.ytimg.com/vi/Du0Xp8WX_7I/mqdefault.jpg)
