Hypothesis Test for Proportion Template in Excel/Google Sheets | Critical & P-values

HTML-код
- Опубликовано: 1 окт 2024
- Of the 200 randomly selected students at a college, 43 apply for financial aid. Test at the 99% confidence level if the proportion of all students who apply for financial aid is greater/different from 30%.
Google Sheets/Excel Template: tinyurl.com/4p...
z-test for μ template: • Hypothesis Z-test for ...
t-test μ template: • Hypothesis t-test Temp...
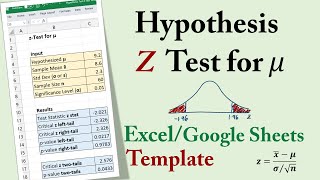


Thank you, your video was to the point and easy to understand. Also, sharing the Excel document was easy to follow. I'm wondering if you use other formulas like Norm.S.Dist or Norm.S.INV to get the test statistic or the P-value?
Yes. If you check the template, you will find that NORMSDIST (older version of NORM.S.DIST) is used to calculate the p-value while NORMSINV is used to calculate the critical values.
I LOVE YOU