Это видео недоступно.
Сожалеем об этом.
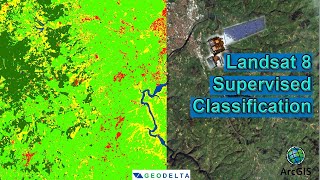
Supervised Classification Using ArcGIS || Landsat-8 Image || ArcGIS Tutorial || GeoFox

HTML-код
- Опубликовано: 10 май 2021
- Hello Everyone, In this video, we will learn how to do supervised classification using Landsat 8 imagery.
Download Landsat 8 Images - earthexplorer....
#ArcGIS_Tutorial
#Supervised_Classification
#Image_Classification
#GeoFox
#CodeNepal
#RemoteSensing
------------------------- My Other Videos --------------------------------
Do watch my other videos:
How To Create A Map With OSM Data Using QGIS:
• How To Create A Map Wi...
How to Create A Choropleth Map Using Leaflet:
• How To Create A Chorop...
Create A Map Layer Using Leaflet:
• Leaflet JS Tutorial ||...
Add A Marker To The Map Layer:
• Leaflet JS Tutorial ||...
Use Different Map Tile Layer In Leaflet:
• Leaflet JS Tutorial ||...
Add Google Map To Your Website:
• Leaflet JS Tutorial ||...
Layer Group And Control In Leaflet:
• Leaflet JS Tutorial ||...
Add Shapefile in leaflet:
• Leaflet JS Tutorial ||...
How to add GeoJSON File in leaflet:
• Leaflet JS Tutorial ||...
--------------------------------------------------------------
Keywords:
supervised classification, land use classification, image classification, arc gis tutorial, ArcGIS, Code Nepal, image classification using arc gis, land classification using arc gis, Landsat 8 image classification, supervised classification using ArcGIS, ArcGIS image classification, ArcGIS supervised classification, remote sensing, supervised classification, Landuse landcover, Landsat 8, image classification, supervised classification using ArcGIS, Image Classification Using ArcGIS, ArcGIS image classification, codenepal, Arc GIS tutorial, gis tutorials, remote sensing, how to do supervised classification using ArcGIS, Supervised classification using ArcGIS, how to do classification in gis, gis supervised classification, land use land cover map, LULC Map using ArcGIS, ArcGIS land use the land cover map


Very clear explanation.
Glad you liked it. ❤
Very nice ❤
Thanks 🤗
hi i want your help here, after creating the composite it has been difficult to connect the shape file to ArcGIS satellite image. i have marked the area of interest but i am not doing it right.... i think am jumping a step. i welcome learned friends and mostly the teacher here if you have the time
that's is helpful. I noticed that you just switched between band combinations while taking training sample as against using an online base map for identifying features as some people do. which is better ?
It can be true all the time. Using base map sometime can lead to wrong training sample. It is always suggested to use the band combined images.
composite bands show band 1 band 1 and band 1. Dont use composite bands from window analysis. Use composite band tool from arc tool box. You will have composite image with band 1 2 3.
Thank you very much for the suggestion. Highly appreciated.
Sir, my research / dissertation topic is : Monitoring sal forest decline through remote sensing time series analysis.
What type of methods should be apply there?
Please help?
Lets connect on whatsapp +9779867755762
@@thegishub Thanks Sir
Please help
Sir, what is the difference between Interactive supervised classification and maximum likelihood classification?? Thank you in advance.
Interactive supervised classification is a process in which a user manually assigns training samples to different classes, and then uses this "supervised" training data to train a classifier. This classifier can then be used to classify new data points based on their similarity to the training data.
Maximum likelihood classification is a technique for estimating the parameters of a probabilistic model and then using these estimates to classify new data points. In maximum likelihood classification, the classifier assigns a new data point to the class that maximizes the likelihood of the data point given the class.
One key difference between the two approaches is that interactive supervised classification requires manual input from the user to assign the training samples to different classes, while maximum likelihood classification does not require this type of manual input. Additionally, maximum likelihood classification involves estimating probabilistic models, while interactive supervised classification does not necessarily involve probabilistic modeling.
Sir how accuracy assessment of past satellite images like 2000 & before 2000 will be done?
I think you can get the sample data from google earth's historical images.
How to adjust the shape file / How you created the shape file here?
I had the shapefile of my area of interest already that is of rupandehi district. So I used that to cut out my area of interest. You can add any polygon shapefile for your area and use extract by mask.
Can you use satellite imagery from Collection 2 level 1 for land classification?
I don't think so.
Though its late but maybe it might help somehow.. collection 2 level 1 data is in form of Digital Numbers (DN-Values), so to obtain better results in your classification you need to preprocess the data (radiometric and atmospheric corrections - preferably FLAASH) in order to get surface reflectance data of your image.
Why not composite button working here / showing not active here
Go to Customize -> Toolbars and then tick on the image classification.
Maybe different function are running here. After selection of all band then by right clicking upon the band shows it on the display.
Thank you.
How many sample / features should be collected
Please reply
It depends upon the accuracy you are looking after. More the samples, more the accurate your LULC will be.
@@thegishub For forest monitoring decline which band combination should be there.
10Q