Dear Sir, I recently came across your insightful RUclips tutorial on Landsat 8 Image Classification using QGIS, and I truly appreciate the clear and informative content you provided. Your step-by-step guidance was immensely helpful. I would love to see similar tutorials for Landsat 8 Image Classification using ArcGIS and RStudio. If you've already covered these topics, could you please share the links in the comments section? Your expertise is invaluable, and your tutorials make complex processes accessible to learners like me. Thanks again for your dedication to sharing knowledge!
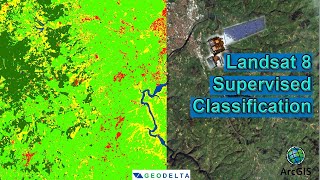
Just to add when RGB is 4-3-2 it's natural colour or True composite. Anything other than that like 5-4-3 (colour infrared) would be False Colour Composite (FCC). Very nice tutorial. Really helpful. Thanks
This is such a wonderful presentation, absolutely wonderful job. Your patience and articulation makes this work much easier. Thank you, you have earned yourself a subscriber.
I'd like to thank you so much for the nice tutorial you've come up with on SCP. For me, it's just the beginning of a long journey, but now I feel encouraged to move forward. Keep posting more you're an excellent coach!
Thank you so much brother for such a great tutorial! Please make some tutorials on Landsat 8 unsupervised image classification, cloud masking, accuracy assessment, and LULC change prediction with CA-Markov Model.
Lovely and very informative video. Thanks. Kindly make the next video on converting it in to vector and calculating amount of the given classes please. Kindly also make a video over authenticity check of the whole classification in case we need to do it for scientific publication please
HI, Everything was going good. I was following all of the steps but during 26:28 the option you go for i.e classification. I am not getting this option displayed there in its place. I have only option of Home, Training inputs and ROI. Do you have any idea to make it show up? Thanks
I feel at 8.37 minutes wavelength setting is not correct...as it is for 2,3,4,5,6,7 not for 1... Please see in your video center wavelength shows 7.0; that is not correct. But I must appreciate that it is excellent guide
Thank you for your video. When it comes to RT_clip bands I can't get file for the first band (B1). Only next six bands. What can be the reason of such difference with the result of SCP in your case?
@@ARIJITGEOLOGY I figured it out. There should be some option to active them while loading the Reflectance Bands from Clipped ones. As I was working using Sentinel - 2A satellite imagery, I was able to activate it. I couldn't able to find while working with LANDSAT imagery tho. at 09:37 that guy has an option only to blue and green bands option. May be we should check that option to get remaining bands.
Thank you very much for this. Please, I tried the tutorial but whenever I do the reflectance from the clip files, band 1 is always omitted! I have tried all I know, including upgrading Qgis to the latest version still no success. Please I will need your help here. From one of your devouted students!
According to the "Frequently asked questions" of the plugin, there are some bands that the plugin avoids in the pre-processing for a semi-automatic classification. "Which image bands should I use for a semi-automatic classification? In general, it is preferable to avoid thermal infrared bands. If you are using Landsat 4, 5 or 7 you should select bands: 1, 2, 3, 4, 5, 7 avoiding band 6 that is thermal infrared; for Landsat 8 you should select bands: 2, 3, 4, 5, 6, 7. Landsat 8 band 1 is generally avoided because it is very similar to the blue band and it is mainly used for coastal aerosol study. Landsat thermal infrared band is excluded from classifications because values are mainly related to object temperature." Maybe he is using another version of the plugin and thats the reason why he still have the Band 1. Anyways, I think that we can use the original Band 1 in the furthing processus.
At 9:36 you've checked "only green and blue bands option" but this option isn't showing in my interface. Only "add bands in a new bandset" option is available. What should I do?
Hey🙌🏻 i think i have the same problem as you at 8:56. I can‘t choose the folder „clip“ for „directory containing landsat bands“. No meta data or bands are found. Do you habe any solution? Cause you skipped the problem and everything worked.
I’ve downloaded the zip file and I found xml format (not mtl) I’ve tried to convert it to .txt but it doesn’t work . Could please explain how can I risolve this problem? Thank you so much
Hi mate, i have a question, i don't have the classification option below the training input, do you know why it could be? i have Qgis 3.16, cause of this problem i can't go on with the process :c
10:48 After you performed the atmospheric correction, you got output from all the bands from B1 to B7 but while replicating the same in my pc, I am missing B1, due to which 1 has Band no.2, and no. 2 has band no.3 and so on... Why am I not getting the atmospheric corrections for Band 1, I am using Landsat 8 imagery just like yourself. Please help.
I have same problem and didnt find the correct answer yet! Where is the band 1 after athmospheric correction? I tried with 3 different places images.In first there are 1.band but after athmospheric correction there are no 1.bands...Strange! So just i have 2-3-4-5-6-7 . band.Natural band combinations arent showing for 4-3-2 for L8. If you use 3-2-1 , İt seems natural.But L8 has to use natural colour for 4-3-2?
@@ArcGIS88 Yes! I looked for similar videos and all of them seem to use the bands from 2 onwards. But I think that is wrong. For the placement of the bands itself, just keep the band 1(uncorrected) or Clipped in the band set itself, and then we will see 4-3-2 natural color, but we will not be able to use number 1 band because it wasn't produced after atmospheric correction.
Thank you so much for these wonderful tutorials. Please can you do a new tutorial for the updated earthexplorer website? it's difficult to get this image as you did with the updated website. thank you
Thank you very much for this very rich video. Please, could you produce another wich shows how to cut the part of NDVI for exemple according to the limits of the zone of study.
First of all thank you this helpful tutorial..My data set is belong to Landsat 8 and also Level-2 and Collection-2. So what should i do those data set? Which stage should I start from? thank you so much :)
How does it work for Landsat 5 for instance that band 6 is the thermal band? I should not add it to the lot of bands that will be analyzed, is that correct? what will change in the process, can you say?
Is it possible to create a ground hillshade type model (to see ground features) with just DEM and Landsat 8 (for when NO LiDAR is available)? For example, do math on a DEM based on a classification mask? I know that LiDAR will have less holes because a laser gets to the ground more than a Landsat band would, but that is ok if it averages out the parts that did get through. It just won't be as accurate? Thanks
This is another GREAT tutorial! One question, when in training mode, can the layer be switched on/off with an orthophoto underneath that could be used to reference between forest and fields? Please continue making these videos - you are a great teacher! On another note, I am looking for ways to identify flash flood areas using QGIS and then using HEC-RAS to create predictions for various percent of risk. I'm comfortable with catchment delineation and Straher identification, but get lost in where to dig into the Hec-Ras transition. Suggestions?
1. Yes, that's totally doable 2. The entire process itself can be quite complex, but to squeeze out the gist of it; You need to have a calibrated hydrological model to provide the catchment flow inputs to your HEC-RAS model. HEC-HMS is a suitable model to do this. Once you have a calibrated hydrological model, what your simulations can provide you are the design steamflows corresponding to different return periods. Once you have this, you can start building your HEC RAS model. Ideally, you should calibrate your river model using some observed flow or water level data, and for an accurate representation of the river, you may also use river cross sections obtained through a proper river survey. Once this step is done, you can provide the design flow inputs and simulate the flood scenarios for different return periods. What you get in this manner as the flood depth is the Hazard. But since you are talking about risk, risk is generally termed as the product of hazard and vulnerability. You already have the hazard maps, now you need to find a way to create the vulnerability maps. I think you can do a bit of research on how to do this. Once you have the hazard and the vulnerability maps, you can use GIS tools to derive the risk maps based on that. To top it off, you may classify your map into categories like Very high risk, high risk, medium and low risk, base on your interpretation of the values.
Thanks alot very helpful video. Please tell one thing ,my area of interest covering under 5 images of Landsat8 so do i need to first merge same number band of different area or it can be done directly in SCP plugin.
This is very useful. I am a complete novice in this area, please could you explain to me how to acquire the data over an entire country. The USGS website limits the images to very small areas or am I doing it wrongly?
Thanks for the video. I'm following along and tried to clip the Landsat images to a shapefile of a watershed that I already had created. This resulted in QGIS hanging up and not responding, so had to force quit. I'm not sure if this is a glitch with QGIS (the latest version seems to have a few bugs) or perhaps this task is too resource-intensive. If you have any suggestions, I'd appreciate them. Thanks
Hi, I was wondering if you would be able to make a similar but looking at mapping change over time? I am currently working on my undergraduate dissertation looking at vegetation change in north east Iceland from 1970-2020 at 5 year intervals using Landsat data. Any help would be greatly appreciated! Thanks in advance :)
Thanks for the effort put into this video. I follow it exactly and am ok with the clipping of multiple layers. However, when I move on to the reflectance section and run the 'Landsat' preprocessing step I only get 6 new relectance layers rather than the full 7 (Layer .....B1 is missing). Does anyone know what is going wrong? (The step finishes at timepoint 10:00 in the video)


Dear Sir, I recently came across your insightful RUclips tutorial on Landsat 8 Image Classification using QGIS, and I truly appreciate the clear and informative content you provided. Your step-by-step guidance was immensely helpful. I would love to see similar tutorials for Landsat 8 Image Classification using ArcGIS and RStudio. If you've already covered these topics, could you please share the links in the comments section? Your expertise is invaluable, and your tutorials make complex processes accessible to learners like me. Thanks again for your dedication to sharing knowledge!
you’re literally the only person saving me on this topic 😭 thank you so much 😭😭😭😭
Just to add when RGB is 4-3-2 it's natural colour or True composite. Anything other than that like 5-4-3 (colour infrared) would be False Colour Composite (FCC).
Very nice tutorial. Really helpful. Thanks
Thanks
This is such a wonderful presentation, absolutely wonderful job. Your patience and articulation makes this work much easier. Thank you, you have earned yourself a subscriber.
I like the voice. It is soo clear and addictive😊
Thanks :)
I'd like to thank you so much for the nice tutorial you've come up with on SCP. For me, it's just the beginning of a long journey, but now I feel encouraged to move forward. Keep posting more you're an excellent coach!
You are welcome :)
Eagarly waited, Thanks for tutorial.🙏
mero klms ley kaam garena k vai yr
This is absolutely brilliant. It is easy to understand and follow. Thank you so much for this. I am more knowledgeable in this now than before.
Mind-blowing explanation brother
Oh my God! You so good. I am lucky i jumped on this tutorial
Thanks man. I like your step by step explanation and also you have a nice voice.
Thanks :)
Thank you sir.....this is such a wonderful explanation, keep it and cheers🖒
Glad you liked it
The nicer tutorial for this tool. Thank you dude!
Thank you very much sir. May God bless you.
Thank you very for your all tutiorials, I am very glad this
Can you please make a video that goes further, converting this file into vector and then calculating the surface area of each elements?
Vim aqui só pra te dizer que você tem um grande fã no Brasil, meus parabéns pelo incrível tutorial 👏👏
Thank you so much brother for such a great tutorial!
Please make some tutorials on Landsat 8 unsupervised image classification, cloud masking, accuracy assessment, and LULC change prediction with CA-Markov Model.
A great video. Many thanks!
Thank you
This was an excellent tutorial! Thank you!
You are welcome :)
Really helpful tutorial, thank you!
You are welcome
thanks for your clear explanation
You are welcome!
Thanks for your presentation, it is much helpful.
No problem 👍
Great job... Keep on doing 👍
Lovely and very informative video. Thanks. Kindly make the next video on converting it in to vector and calculating amount of the given classes please. Kindly also make a video over authenticity check of the whole classification in case we need to do it for scientific publication please
Excelente...tutorial👏👏
HI, Everything was going good. I was following all of the steps but during 26:28 the option you go for i.e classification. I am not getting this option displayed there in its place. I have only option of Home, Training inputs and ROI. Do you have any idea to make it show up? Thanks
Same thing goes for me. Have you located your classification already this time?
Excellent class
Thank you so much for this tutorial. Could you also explain how to impove the accuracy of the classification?
Thankyou for the video. It's helpful
You are welcome
Nice one. Thanks so much
Glad you enjoyed it
Nice sir..👍& thank you for this tutorial 🙏
I feel at 8.37 minutes wavelength setting is not correct...as it is for 2,3,4,5,6,7 not for 1... Please see in your video center wavelength shows 7.0; that is not correct. But I must appreciate that it is excellent guide
Brilliant!!!!!!
very well explained
Very useful tutorial
Thank you very much 💖
You are welcome :)
Thank you for your video. When it comes to RT_clip bands I can't get file for the first band (B1). Only next six bands. What can be the reason of such difference with the result of SCP in your case?
same problem
Same issue
@@ARIJITGEOLOGY I figured it out. There should be some option to active them while loading the Reflectance Bands from Clipped ones. As I was working using Sentinel - 2A satellite imagery, I was able to activate it. I couldn't able to find while working with LANDSAT imagery tho. at 09:37 that guy has an option only to blue and green bands option. May be we should check that option to get remaining bands.
@@suhisuhaas3408 But there is no "blue and green band " option in scp .I have been using QGİS 3.18.I have same problem with you...Did you solve it?
I've been getting same problem, bro@@ArcGIS88 , no option for blue and green band in QGIS 3.10 .. i wish some people could give explanation for it..
Very Awesome!!
Thank you! Cheers!
i cannot find classification in scp dock:( instead i have roi options. what should i do?
Go into the SCP option (next to processing) -band processing-classification
Thank you very much for this.
Please, I tried the tutorial but whenever I do the reflectance from the clip files, band 1 is always omitted! I have tried all I know, including upgrading Qgis to the latest version still no success. Please I will need your help here.
From one of your devouted students!
Same here
According to the "Frequently asked questions" of the plugin, there are some bands that the plugin avoids in the pre-processing for a semi-automatic classification.
"Which image bands should I use for a semi-automatic classification? In general, it is preferable to avoid thermal infrared bands. If you are using Landsat 4, 5 or 7 you should select bands: 1, 2, 3, 4, 5, 7 avoiding band 6 that is thermal infrared; for Landsat 8 you should select bands: 2, 3, 4, 5, 6, 7. Landsat 8 band 1 is generally avoided because it is very similar to the blue band and it is mainly used for coastal aerosol study. Landsat thermal infrared band is excluded from classifications because values are mainly related to object temperature."
Maybe he is using another version of the plugin and thats the reason why he still have the Band 1. Anyways, I think that we can use the original Band 1 in the furthing processus.
@@armandocruz6379 This worked perfectly thank you
At 9:36 you've checked "only green and blue bands option" but this option isn't showing in my interface. Only "add bands in a new bandset" option is available. What should I do?
Thanks!! So helpfull
Thank you so much !
No worries!
great one.thanx
Hey🙌🏻 i think i have the same problem as you at 8:56. I can‘t choose the folder „clip“ for „directory containing landsat bands“. No meta data or bands are found. Do you habe any solution? Cause you skipped the problem and everything worked.
There is no option like landsat available under the prepossessing menu, please help. Do we have to install another plugin for that
which band should I use for Minerals
While doing the reflectance part, one of my bands(band 1) got vanished. Why this is so?
Can you manage to resolve the problem? Because I have the same issue
I am also having the same problem. Have you found a solution?
@@irmak3667 Idem, same problem
Thank you very much.
would be grateful if you give a session on creating a lookup table in Qgis and CN curve.
Really helpful. Can you upload the next tutorial on how we can do image classification using advanced ML algorithms in python??
I’ve downloaded the zip file and I found xml format (not mtl) I’ve tried to convert it to .txt but it doesn’t work . Could please explain how can I risolve this problem? Thank you so much
Thank you for this video, can you tell me wich type of image you download ? I tried GeoTIFF but it is very long..
Nice teaching
I would like to thank you so much, but I have a question. The Landsat 5 TM can be used for the SCP for classification?
@geodelta labs
I have tried this, but in middle of saving MC id it shows error and my laptop getting shutdown.
Excellent
Hi mate, i have a question, i don't have the classification option below the training input, do you know why it could be? i have Qgis 3.16, cause of this problem i can't go on with the process :c
10:48 After you performed the atmospheric correction, you got output from all the bands from B1 to B7 but while replicating the same in my pc, I am missing B1, due to which 1 has Band no.2, and no. 2 has band no.3 and so on... Why am I not getting the atmospheric corrections for Band 1, I am using Landsat 8 imagery just like yourself. Please help.
I have same problem and didnt find the correct answer yet! Where is the band 1 after athmospheric correction? I tried with 3 different places images.In first there are 1.band but after athmospheric correction there are no 1.bands...Strange! So just i have 2-3-4-5-6-7 . band.Natural band combinations arent showing for 4-3-2 for L8. If you use 3-2-1 , İt seems natural.But L8 has to use natural colour for 4-3-2?
@@ArcGIS88 Yes! I looked for similar videos and all of them seem to use the bands from 2 onwards. But I think that is wrong. For the placement of the bands itself, just keep the band 1(uncorrected) or Clipped in the band set itself, and then we will see 4-3-2 natural color, but we will not be able to use number 1 band because it wasn't produced after atmospheric correction.
I am not able to create more than two ROIs even if I am holding down control key. What's the problem?
Hello, i have a problem while i'm making the reflections. The process is stucked on 60% . I don't know what i should do . Please help, thanks
Thank you so much for these wonderful tutorials. Please can you do a new tutorial for the updated earthexplorer website? it's difficult to get this image as you did with the updated website. thank you
I am unable to get the option add band to band set, also in the SCP dock there is no option of class id. Any suggestions on how to work on that?
reason of not using band 8 til band 11? SCP do not process band 10,11?
Sir during conversion of clipped into RT, band 1 is not getting converted, why? Please explain or tell me how to deal with it
AT 5:35 when we need to select area on the map the red highlight box does not appear for me does anyone know how to resolve?
Thank you very much for this very rich video. Please, could you produce another wich shows how to cut the part of NDVI for exemple according to the limits of the zone of study.
I have a doubt
The bands are not in order. Even if I rearrange them in the layers tab in the plugin they remain the same. What should be done?
Which plugin we should use for raster unique classification of this image?
is it better to make a composite band before classification?
Hi Bro, I applied the same processes, but the stream was not blue and the vegetation was not orange, why did it not?
I have a Mac M1 and the SCP Plugin doesn't work on it. Is there any alternative way to do this? Or any way to make the plugin work?
Hi i want ask bout how after classification, got the coordinates of water region only
please also explain what different colour means in different band combinations?
How can you choose multiple ROI? because it's disappeared whenever I choose another one
Dada, the training inputs I am taking are not doing more than two shows
First of all thank you this helpful tutorial..My data set is belong to Landsat 8 and also Level-2 and Collection-2. So what should i do those data set? Which stage should I start from? thank you so much :)
How does it work for Landsat 5 for instance that band 6 is the thermal band? I should not add it to the lot of bands that will be analyzed, is that correct? what will change in the process, can you say?
in case i want to make the same map for 2010 which landsat should i use ?
when I set the RGB to 4-3-2 or any combination the virtual band set appears black
Hmm that's pretty strange
Very fantastic and interesting job. Can you make another videos on how to improve the classification and the validation?
Could you please make a video on post classification accuracy improvements
Can you tell the steps of study land use and land cover?
Good job, thank you! Tell us how to check the resulting classification and remove single pixels.
This method can be used also for landsat 7 image classification? or is there some changes?
Is it possible to create a ground hillshade type model (to see ground features) with just DEM and Landsat 8 (for when NO LiDAR is available)? For example, do math on a DEM based on a classification mask? I know that LiDAR will have less holes because a laser gets to the ground more than a Landsat band would, but that is ok if it averages out the parts that did get through. It just won't be as accurate?
Thanks
The tutorial is great! But I get huge values for my reflectance layers and I can't find the problem. Any idea?
I dont have clasification tab, what should i do?
getting error while clipping multiple raster as cannot convert float infinity to integer
What version of Qgis is being used here
This is another GREAT tutorial! One question, when in training mode, can the layer be switched on/off with an orthophoto underneath that could be used to reference between forest and fields? Please continue making these videos - you are a great teacher! On another note, I am looking for ways to identify flash flood areas using QGIS and then using HEC-RAS to create predictions for various percent of risk. I'm comfortable with catchment delineation and Straher identification, but get lost in where to dig into the Hec-Ras transition. Suggestions?
1. Yes, that's totally doable
2. The entire process itself can be quite complex, but to squeeze out the gist of it;
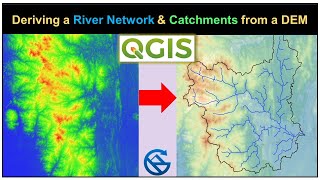
You need to have a calibrated hydrological model to provide the catchment flow inputs to your HEC-RAS model. HEC-HMS is a suitable model to do this. Once you have a calibrated hydrological model, what your simulations can provide you are the design steamflows corresponding to different return periods. Once you have this, you can start building your HEC RAS model. Ideally, you should calibrate your river model using some observed flow or water level data, and for an accurate representation of the river, you may also use river cross sections obtained through a proper river survey. Once this step is done, you can provide the design flow inputs and simulate the flood scenarios for different return periods. What you get in this manner as the flood depth is the Hazard. But since you are talking about risk, risk is generally termed as the product of hazard and vulnerability. You already have the hazard maps, now you need to find a way to create the vulnerability maps. I think you can do a bit of research on how to do this. Once you have the hazard and the vulnerability maps, you can use GIS tools to derive the risk maps based on that. To top it off, you may classify your map into categories like Very high risk, high risk, medium and low risk, base on your interpretation of the values.
Thanks alot very helpful video. Please tell one thing ,my area of interest covering under 5 images of Landsat8 so do i need to first merge same number band of different area or it can be done directly in SCP plugin.
This is very useful. I am a complete novice in this area, please could you explain to me how to acquire the data over an entire country. The USGS website limits the images to very small areas or am I doing it wrongly?
My preprocessing don't have landsat sentinel options
How to use sentinel image for classification
Thanks for the video. I'm following along and tried to clip the Landsat images to a shapefile of a watershed that I already had created. This resulted in QGIS hanging up and not responding, so had to force quit. I'm not sure if this is a glitch with QGIS (the latest version seems to have a few bugs) or perhaps this task is too resource-intensive. If you have any suggestions, I'd appreciate them. Thanks
How can I deal with multiple imageries? as I have big area of interest combining 6 Landsat imageries.
Hi, I was wondering if you would be able to make a similar but looking at mapping change over time?
I am currently working on my undergraduate dissertation looking at vegetation change in north east Iceland from 1970-2020 at 5 year intervals using Landsat data.
Any help would be greatly appreciated! Thanks in advance :)
Did you get the data?
If yes, then from where?
Thanks for the effort put into this video. I follow it exactly and am ok with the clipping of multiple layers. However, when I move on to the reflectance section and run the 'Landsat' preprocessing step I only get 6 new relectance layers rather than the full 7 (Layer .....B1 is missing). Does anyone know what is going wrong? (The step finishes at timepoint 10:00 in the video)
Me too. I wonder why. Might anyone be able to help?
I am Facing that shit....