Conditional formatting for Excel column charts

HTML-код
- Опубликовано: 22 авг 2024
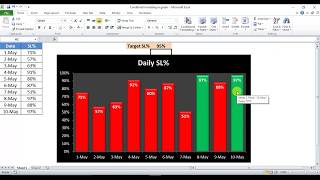
- How can you get the columns in a chart to display in different colors based on the value (often referred to as conditional formatting)? This video shows you how.
For written instructions of the steps in the video, refer to this article: www.thinkoutsi...
These videos are inspired by the work I do with business professionals to visually communicate financial results and analysis as well as the forum posts I answer from users on MrExcel.com.
In this video I show you how to create a column chart that has conditional formatting. You define the groupings based on value boundaries and the chart displays the columns in different colors based on which group that value is in. In the video I am using Excel 365 on Windows 10, and most modern versions of Excel will look very similar. If you like the video, please subscribe to the channel and add a comment below.
If you want to learn what you should do to create presentation-ready Excel charts that are easy to update and re-use, sign up for my free mini-course at thinkoutsideth....
If you want quickly learn expert-level Excel techniques to create presentation-ready charts that are easy to update and re-use without programming, add-ins, or web tools, check out my Excel Chart Skills 501 course at thinkoutsideth....
You can access the entire playlist of Excel Chart Tips videos at www.ExcelChartTips.com.


Genius! What a clever workaround! Solved my problem perfectly.
I'm glad you found the video helpful
This is a bit mind bending, but I worked it out! Thank you.
I'm glad you found the video helpful
nice explanation and got new idea for createing charts.
I'm glad you found the video helpful.
Thank you. This is so useful.
I'm glad you found the video helpful.
It's better create a chart in video itself, so everyone will understand better than this.
Any way good information, thanks for sharing
But what if you have a second data series in the same graph? The overlap does not work properly as you have varying gaps...
Cool trick.... thanks mate
I'm glad you found the video helpful.
Very well explained !!!!
Thank you! Glad it was helpful!
Thanks this is the good trick to support data visualisation.
Great tip. Thank you!
I’m glad the video was helpful!
Awesome tip
Thanks! Glad you found it helpful.
Helped so much thank you.
Glad it helped!
A very clever use, really appreciable
Glad you liked it
How do I set the colour for each Boundry?
THank you
Glad the video was helpful
Can you do this with text grouping? Example: Michael (is one color) and his locations (Paris, Berlin, Sydney), Joanne (is another color) and her locations (Miami, Los Angeles, Seattle), and Brad (is another color) and his locations (Manilla, Hiroshima, Moscow) totaling each cities separate values.
If you make each person a separate data series you can format the values in that data series so the cities for each person have the same color. Hope that helps.
Thank you pal!
Happy to help!
Well I was looking for how to set conditional colorizing section but you don't talk about it?? this was like "look guys I formatted that bar's" but no information how to do?
This is amazing!
Glad the video helped!
Truly helpful, however when Label position is set to 'Inside Base', this does not appear to work.. Am i missing something here?
When i change a value in a column, it moves the column over and combines it with other data
This is great! Any idea how to remove the "NA" label when I am adding labels to the bars?
I'm glad you found the video helpful. The true #N/A error value data points should not be displayed in the graph so there should be no labels there either. Whether the #N/A error value is shown or not is controlled by a setting so it may be that the setting has been changed. Here's how to check.
1. Select the chart
2. Click on the Select Data button on the Chart Design ribbon
3. Click on the Hidden and Empty Cells button in the lower left corner of the dialog
4. Make sure the Show #N/A as an empty cell checkbox is selected
5. Make sure the Show empty cells as Gaps radio button is selected
Hope that helps
Thanks great video, Would you have one video with conditional formatting for PIE chart in Excel (Name instead of Value)
I suggest you look at this excellent tutorial: www.excelcampus.com/charts/progress-doughnut-chart/. It is for a donut chart but the same approach works for a pie chart. If you want the colors based on the name, just change the formula that calculates which data series the value is placed in. Hope that helps.
Please help..
i want show 0.00% in condition formatting bar graph excel..
In custom format I have added 0.00;;;.. but it suppress 0.00 in data and in graph also.. I want show 0.00% in bar graph.. Please help me..
Great video, I have a question, is there any way to do this in a pivot chart? like automatic filters or something like that?
Sorry, I am not familiar enough with pivot charts to know the answer to your question.
Great vid.
How to apply this to environmental data.
You can apply the technique in the video to any data where you want to format it based on groups so it can be applied to environmental or other data too.
How to create a simple Bar chart where the highest & the lowest values will be in two different colours
I think this video from Excel MVP Mynda Treacy will help: ruclips.net/video/9WVI62yP_70/видео.html
thanks :)
I made the beautiful chart with all the formulas but how do I use that data to create the actual chart. Cries* good start but back to the drawing board I guess.
PEOPLE I FOUND IT! If you need help taking this beautiful table and creating the actual chart go here ruclips.net/video/HVo8lxtZtM0/видео.html same concept just combine the two videos and *chefs kiss
Thanks for sharing this video!
I could not understand at all. Can anybody help?
Great presentation! My point is that I would like to put legend. How can i do that? Thanks
The easiest way is to add rectangle shapes to the chart, one for each category. Set the background color to the same color as the category in the chart and add text that explains what that category is. You can see what this looks like in the article for this video at www.thinkoutsidetheslide.com/conditional-formatting-for-excel-column-charts/.
@@ThinkOutsideTheSlide Thanks. I thought that.
What exactly is this video? You are just talking over a previously created stuff.
How did you get rid of NAs in the data labels? Thanks
In the Hidden and Empty Cell Settings dialog box that can be accessed from the Select Data dialog box, make sure that the "Show #N/A as an empty cell" setting is checked and the N/A labels should not appear.
How do you set/change the colors?
Each data series has its own fill color so you can set the colors for each set of columns by changing the fill color for that data series.
How do you hide the #N/A label? there will be bunch of #N/A label in the bottom of the chart
Excel does not plot the #N/A values on the chart so there are no labels for those values. This is a trick I use often to customize labels in Excel charts.
I fixed it
i was doing well until i try to make a chart in a list that, for exemple: group 2 is all #N/A, so i can't select because there's "no data"
print: prnt.sc/vdblmm
how can i format chart area according to cell colour in excel
I am not sure but I suspect that it may only be possible by using VBA which I am not knowledgeable enough about to give advice on.
Is this dynamic?
It depends on what you mean by dynamic. Since it uses formulas and parameters to determine the colors of the columns based on their values, I would say that it is dynamic since you can change the parameters and the formulas will change the colors automatically.
Too bad this won't work with line charts.