Good Lord I just spent 4 hours worth of Uni classes trying to grasp Linear regression using excel and you taught it to me in 10 minutes. You really just saved me!
Why didn’t you include the standard error in the equation to predict the price of the house? The formula to predict the y-value is y = B sub 0 + B sub 1 • x + € (that’s supposed to be epsilon).
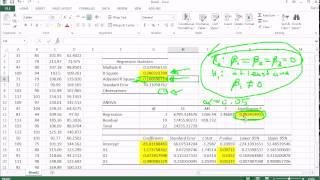
Yes that's right the presentation of the equation includes an error term, but it is expected to be 0. We don't use it to calculate the least squares line. Standard error is an altogether different term though. If I were calculating a prediction interval or confidence interval then I would need the standard error.
In the example, the p-value for the intercept is 0.41919 which is greater than 0.05 right. So what happened to the intercept value? do we use the value of -222.68?
Hi. In general we don't do anything with the intercept p-value. It's the slope p-value we are interested in. P-value will always be positive, the -228 number is the t and with such a high t you must have a very low p-value indicating that in all likelihood the slope is not 0,


Good Lord I just spent 4 hours worth of Uni classes trying to grasp Linear regression using excel and you taught it to me in 10 minutes. You really just saved me!
Thanks. Glad it helped.
Matt, your brilliant video explained linear regression perfectly. thankyou.
Thank you. Glad it helped.
You're the best instructor ever! Thanks you!
Thanks. Glad it helped.
Absoulte legend!! Made my home work make sense in 10 minutes.
Thanks. Glad it helped
thanks sir for the great explanation
Glad it helped.
Really detailed video. super helpful!
Thanks. Glad it helped
Outstanding video!
Thanks very much. Glad it helped
You saved my night! Thank you! [3:25]
Glad it helped
excellent explanation sir🎉
Glad it helped
Excellent video
Thanks. Glad it helped
thank you 💙
Glad it helped
Thanks!
Thanks very much. Glad it helped
thank you!
Glad it helped.
This is awesome. Great video.
Thanks. Glad it helped.
Lifesaver
Glad it helped
Master class
Glad it helped
Why didn’t you include the standard error in the equation to predict the price of the house? The formula to predict the y-value is y = B sub 0 + B sub 1 • x + € (that’s supposed to be epsilon).
Yes that's right the presentation of the equation includes an error term, but it is expected to be 0. We don't use it to calculate the least squares line. Standard error is an altogether different term though. If I were calculating a prediction interval or confidence interval then I would need the standard error.
In the example, the p-value for the intercept is 0.41919 which is greater than 0.05 right. So what happened to the intercept value? do we use the value of -222.68?
Hi. In general we don't do anything with the intercept p-value. It's the slope p-value we are interested in. P-value will always be positive, the -228 number is the t and with such a high t you must have a very low p-value indicating that in all likelihood the slope is not 0,
Thank you so much, I understand now👍👍👍
how do i do this on a mac book pro??? I tried holding the alt key pressing t and i and it didn't work for me .
Do you how do you turn on Data Analysis? It's in the Tools menu at the bottom you will see Excel Add ins.
For every one sq.ft increase, the sale price increases by 2.12 or 2.12 multiplied by 100?
The data are in the same scale so it's 2.12/sq ft, but yes to get back to the original data it's 212/sq ft.
后卫
好的