Excel Multiple Regression

HTML-код
- Опубликовано: 1 июл 2024
- Excel Multiple Regression
softtechtutorials.com/microso...
0:00 Excel Multiple Regression Intro
0:42 Data Analysis Toolpak
1:07 Multiple Regression in Excel
1:58 Excel Multiple Regression Analysis
2:35 Regression Statistics
3:08 Regression Analysis - ANOVA
3:43 Regression equation and p-values
5:44 Forecasting
In this video, we will show how to do multiple regression using Excel. Multiple regression is a method used in statistics to predict the outcome of a response or dependent variable using two or more explanatory or independent variables.
To do the multiple regression, we need to make sure that the Data Analysis Toolpak is loaded in Excel. In the Data tab you select Data Analysis and then Regression. A menu opens where you can insert the dependent and all independent variables.
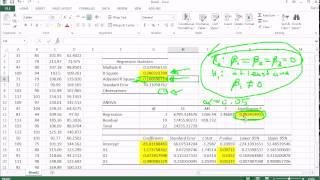
The output of the analysis is divided into three parts. First, we have the regression statistics that tell you how well the calculated linear regression equation fits your data.
The second part shows you the different components of the sum of squares and gives you an idea of how reliable the model is.
The final part of the regression output represents the different variables in the regression and the linear regression equation.
In the regression statistics part, the most important figure is the adjusted R square. It represents the R square adjusted for the number of independent variables in the model. In the case of multiple regression, you always want to use this form of the R square.
Next in this Excel multiple regression tutorial we take a look at the ANOVA table. The ANOVA table shows the reliability of our model. The most important figure in this context is the Significance F value which is the probability that all regression coefficients are 0. In other words, we test the reliability of the entire model.
When the Significance F is smaller than 0.05, we reject the null hypothesis that all regression coefficients are zero and we can say that the model is reliable. In our case the Significance F value is well below that threshold, so we can conclude that our entire model is relevant for our data.
The first column in the third table gives the estimated coefficients for the regression equation. The second column “Standard Error” gives the standard errors or estimated standard deviations of the least-squares estimates. For the third column, we first have to say that Excel performs hypothesis testing for each regression coefficient.
Excel tests the null hypothesis that the coefficient is zero. The “t Stat” and “P-value” columns show the corresponding t-statistic and p-value for these tests. The last two columns show the 95% confidence interval for the regression coefficients.
Now, we focus on the p-values as these are the most important figures besides the regression coefficients themselves. A commonly chosen threshold to say that the coefficient is significantly different from zero and hence that the independent variable is relevant is 0.05.
When the model is defined, you can use it to forecast the dependent variable based on given values for the independent variables.
This concludes our Excel Multiple Regression tutorial. I'm inspired by content creators as Leila Gharani and Teacher's Tech.
#Excel #Tutorials #Statistics


The things you know about excel blow my mind! Another superb guide.
I'm glad you like it. Big thanks for the support!
You're really good at explaining 👏, understood very well, thank you.
This video literally helps a lot! Thank you so much!!
Thank you this helped me so much!
Wonderful explanation and video flow. Totally underrated
Much appreciated! Comments like these make it worthwhile.
thanks so much! very helpful and well explained!!
You're welcome! I appreciate the comment.
thank you so much, now I know regression better.
You're welcome! Glad I could help
Great video. Thanks
Thanks dude! great explanation!!
You're welcome! I appreciate it
hi, to supplement the auto-generated tables you showed, how can we analyse the variation of the trend line from the scatter plot data values? is there a specific method to go about doing so? thank you!
Nicely explained.Thanks a lot
You’re welcome! I appreciate the comment big time.
Bless u man!
How do you get adjusted odds ratio for each individual variable
Well presented
highly appreciated.
That's great to hear! Thank you.
how u plot the scatter graph and equation of trend line... plz make a video on this
how do you get the Forecast Table of Distance and Duration ?
Thank you
Well understood
Can you expand on this model and create an upper limit and lower limit for your forecast?
My P value of Intercept is coming more than 0.05 for my research project.
Should I ignore it?
Hello, thank you for explaining. Can you please explain this? - On what basis do we select a particular variable to be dependent or independent?
to my knowledge when using this method to impute some missing file for my dataset the Y or dependent variable is the variable that you want to predict or forecast while the X variables is the independent label that to be used for predicting the Y variables or the dependent, so yeah if you want to predict someone's BMI you can use the BMI as the Y and X would be something he does for an everyday life and see which of those data corelate highly with Y and would help with regression
Well understood, but please how did you draw the graphs of the independent variables?
Put in simple graph for those columns and add a trendline
can this be used to do cannibalization analysis?
Then this window shows up “ having trouble to offset input/output references.” I need solution pls
There is no option of data analysis in my laptop how can I manage it.??
Sir I've tried my best but after multiple trials my regression model is showing no P value less than 0.05. What to do ?
that means you cannot reject the null hypothesis, so whatever your trying to prove or look for cannot be proved or confirmed
What happens if, for the forecast, one value is missing? Let's say, you wanna do the forecast but the value for distance is missing?
You fill it with estimate/avg
Very good explanation. Indeed. Clear. Sucint. to the point. Please, please do not end every sentence with an intonation as if it were a question. It is an insufferable USA mannerism.
my P-value become NUM? WHY
Too technical, can you explain in layman's terms?
the forecast