Это видео недоступно.
Сожалеем об этом.
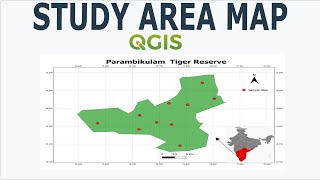
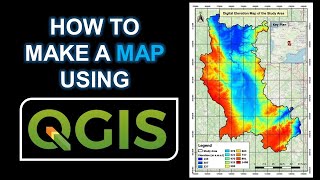
Prepare map in QGIS || Introduction to QGIS print Layout

HTML-код
- Опубликовано: 1 авг 2024
- Here we will prepare a map in QGIS. After this tutorial you will able to make the map of your own concept in QGIS print layout.
Please subscribe the channel! Like and share the video
Data link to practise along with the video:
drive.google.com/file/d/1wu_8...
Practice along with the video with above link and you will be almost perfect on QGIS print layout.
Good luck! Happy learning!


Very clearly demonstrated, thanks!
Extremely helpful, thank you🔥🔥🔥
Excellent explanation, thank you
Best video ever! Thank you!
Very useful, thank you!
Excellent Tutorial
Thank you so much, you saved my life
This is great! Thanks!
You are a wise man
You're amazing! Tkank you bro
Much appreciated!
You are the best
Very useful. I don't know how to thank you.
Excellent explanation. Very useful
Thank you so much brother 🙏
Thank you sir
Thanks sir
thank you :->
Thanks
Hello there, thank you for the very helpful video. How do I know which Zone to use for my region? Would appreciate your help, cheers and thanks!
GREAT video thank you. I have noticed that when I "Add picture" over the top of my background map, it makes the picture about 50% transparent. Rendering has Blending mode 'normal and opacity 100%. Do you know where is the transparency in the picture coming from?
The transparency in the picture may be coming from the image file itself. Many image file formats, such as PNG and GIF, support an alpha channel, which can be used to specify the transparency of each pixel in the image. If the image you are adding has an alpha channel, QGIS will automatically use it to determine the transparency of the image when it is added to the map.
If you want to remove the transparency, you can use an image editing software to remove the alpha channel from the image file, or you can set the transparency to 0% in the Layer Properties.
Another way to check is to set the Blending mode to "Multiply" this way the image will be opaque, and will not be influenced by the transparency of the image.
Please update us if the problem is solved or not. There may be other several reasons which we can explore.
Happy learning.
I cant seem to configure the x and y cooridnates for the grid? Im confused
My OCD hates that your arrow lines aren't perfectly vertical/horizontal
when i try to export as a form of image it is export or saved only the layer ( the coordinates) i can not export the drown map or lines
Please visit the export settings. There might be some problem.
How to create Landuse: Forest, River and Settlement? Can I not send the polygons?
You can create Polygons using Google earth or satellite image or download the digital layer from websites.
By any chance, can we change the vertical ascending numbers from 3--------------- to two digits?
There may be an option for this
data link is dead!?
Sorry for the inconvenience. The link has been updated.
Happy learning
Where did you get this data i need it
Can you use it to specify different time frames
Hello! This data is made by image reclassication of the satellite image. You can get the satellite image of different time frame and reclassify the landuse.
I hope I gave you the answer. For any confusion, feel free to comment.
Happy learning
Do I need to use NDVI for that?
How to Save the map as image to desktop
Please follow the steps. You can export in image very easily.
I need to understand ur data acqusation as soon as possible
Or you can use Google earth and make polygons of lands use or landcover of different time frame.
ruclips.net/video/c_ffQCBEuM0/видео.html
Here is the link you can follow to prepa landuse Data from Google earth. Good luck.