Mean Standard Deviation and Variance in EXCEL for Grouped Data | Easy way |

HTML-код
- Опубликовано: 21 авг 2024
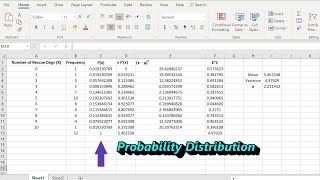
- In this video you will learn how to find Mean Standard Deviation and Variance in EXCEL for Grouped Data
After watching full video you will be able to find
1. how to find mean for grouped data in excel?
2. how to find Standard deviation and variance for grouped data in excel?
if you like our video subscribe our channel and share our video with your friends also.
Join this channel to get access to perks:
/ @gouravmanjrekar
👉 SUBSCRIBE : www.youtube.co...
👆👆👆
~-~~-~~~-~~-~
Please watch: "UNBALANCED ASSIGNMENT PROBLEM IN OPERATION RESEARCH | USING HUNGARIAN METHOD | Lecture 03"
• Unbalanced Assignment ...
~-~~-~~~-~~-~


This is the easiest way of doing sd of grouped data on the whole RUclips ...congrats bro ..keep it up
Thanks a ton
Keep watching
Ever heard of the formula var.p !?
Thank you awesome lecture explained i also learn something about Ms Excel too along with solving questions.....😊
Thank you so much Gourav Manjrekar, you have no idea how much this helped do my assigment for math. I am so grateful
Keep watching
Share our video with your friends also
Statistics Using Excel ( In English language): ruclips.net/p/PLRNL7AjA6rjxsZAP6LhM3Wlc4IaqrnE1u
Thankyou so much sir for such easy and effective explanation..you saved my test today🙏
Keep watching
Share our video with your friends also 😊
Thanks a lot Sir for a clear explanation.
Keep watching
Subscribe our channel for more videos
Statistics Using Excel ( In English language): ruclips.net/p/PLRNL7AjA6rjxsZAP6LhM3Wlc4IaqrnE1u
Sir thanks alot for your vedios these helped me alot for my university exams and I gained A plus for my quantitative technique examination...
A student from Kerala 🙏🙏
Congrats 👏
Share our video with your friends also 😊
Thanks alot. Numbers are different but this is actually the same thing on my question paper
Thank you
thanks m8
Good Morning Sir...
Good morning
Share our video with your friends also
nice
Keep watching
Share our video with your friends also
hi sir why is it that we were taught to deduct 1 from the n in the denominator of the variance formula
Hello sir, the ''x-xbar'' column I didn't understand why is it used for? Because I am trying to explain that in my Math Assignment but I dont know how to. Couldyou please explain me?
It is used to calculate SD and variance
First we find X-Xbar and then ( x-xbar) square