I am very impressed as it is all Curriculum based , to the point and exactly was I was searching for. Thanks for helping our struggling Student community. Thanks again.
Quite useful, however I think you should do a real life example with data such as temperature trends since the data used here is fairly straightforward. None of the graphs I make are as smooth as the one you have using real life data.
It doesn't work for me: In my list of data there are repetitions of the same number so I only get a NUM! error and the bellcurve chart cannot be created.
I am working with this relatively easy method for crop yield data over 1000 data points but the result is ab(normal). The other method is typical but the graph is normal.
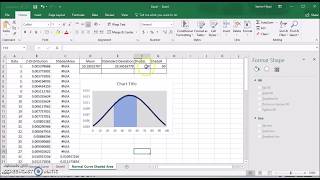
Thanks. "The Excel NORM.DIST function returns values for the normal probability density function (PDF) and the normal cumulative distribution function (CDF)."


I am very impressed as it is all Curriculum based , to the point and exactly was I was searching for. Thanks for helping our struggling Student community. Thanks again.
Great to hear!
thank you, your explanation is very clear and simple to understand.
Very well explained. Thanks a lot.
Glad it was helpful!
Quite useful, however I think you should do a real life example with data such as temperature trends since the data used here is fairly straightforward. None of the graphs I make are as smooth as the one you have using real life data.
Thank you for sharing this well-paced resource. I used it to process some PhD data.
Thank you for sharing. Very helpful
It doesn't work for me: In my list of data there are repetitions of the same number so I only get a NUM! error and the bellcurve chart cannot be created.
I am working with this relatively easy method for crop yield data over 1000 data points but the result is ab(normal). The other method is typical but the graph is normal.
Thank you for posting such a simple yet useful video!!
Wesley Lee you are welcome
My curve doesn't look like a curve. The area under the curve is shaded. Don't know how to fix that?
Thanks.
"The Excel NORM.DIST function returns values for the normal probability density function (PDF) and the normal cumulative distribution function (CDF)."
why does mine look like scribble scrabble :(
sir, where's the tab 4 function in the keyboard? i cannot find it. thank you
F4
You may have to press function (fn) key with f4…my f4 alone defaults to screen brightness capabilities.
Very well done, sir
Thank you kindly!
Very helpful. Thank you!
R. James you are welcome
Thanks!
does the data have to be organised into ascending order?
yes
Good video
Do you offer a Tutorial? Very Informative = )
What kind of Tutorial.
THANK U SIR