OHHH since its not evenly distributed it won't look smooth! THANK YOU SO MUCH FOR THE EXAMPLE WITH THE STUDENTS! I've been racking my brain trying to find an answer for the graph I had.
thank you for going over the practical bell curve at the end of the video, I kept getting something similar to what you had in the practical example and thought that because it didn't look like the bell curve that you had in the first example that I was doing something wrong.
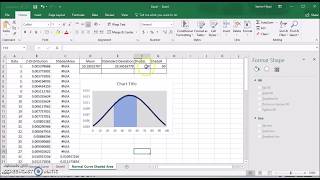
They are doing something wrong. They are related the data back to the number of markers instead of the grades. If you look, the x axis should be from 30 to 100, but it's from 0-30.
@@stephenjackson5628 Thanks Stephen for your feedback. The x-axis shows the count of data points in the bell curve. In our example, there were 27 data points, hence the x-Axis is showing from 0-30. Do let me know in case of further clarification.
Thanks TheNemesis. The smoothness of the bell curve depends on the smoothness of the data. If we have perfectly distributed data (like in our first example), then we can get the smooth curve. In all practical cases, we will get a somewhat distorted curve (like in second example). Hope this clarifies.
Truly great effort and I still have few questions. Q1. Area , SD, %age and values significance? Q2. How are we using Mean and SD in Bell curve ( I believe Mean should be peak of this curve a line in between and SD the gap between intervals on X Axis. Need more on this. Q3. NormDist is plotted on Y Axis....But what does it give to me? What is its significance? Q4. What is the usage of this Curve/ Bad and Good Curve?
Using the FALSE function might lead students (e.g., me) into thinking these normal distribution values are the actual probabilities (or you might also call it "areas") of getting data less than or equal to the raw data that corresponds to a z-score. I hope you could explain this more thoroughly. Still, thanks for the video!


OHHH since its not evenly distributed it won't look smooth! THANK YOU SO MUCH FOR THE EXAMPLE WITH THE STUDENTS! I've been racking my brain trying to find an answer for the graph I had.
excellent teacher, very clear
Why do I get #num after pressing down
thank you for going over the practical bell curve at the end of the video, I kept getting something similar to what you had in the practical example and thought that because it didn't look like the bell curve that you had in the first example that I was doing something wrong.
They are doing something wrong. They are related the data back to the number of markers instead of the grades. If you look, the x axis should be from 30 to 100, but it's from 0-30.
@@stephenjackson5628 Thanks Stephen for your feedback. The x-axis shows the count of data points in the bell curve. In our example, there were 27 data points, hence the x-Axis is showing from 0-30.
Do let me know in case of further clarification.
Thanks TheNemesis. The smoothness of the bell curve depends on the smoothness of the data. If we have perfectly distributed data (like in our first example), then we can get the smooth curve. In all practical cases, we will get a somewhat distorted curve (like in second example).
Hope this clarifies.
great... thanks
Thanks alot for your tutorial, very simple and easy to understand. Be blessed
But what about the student numbers? It's like saying that student 10 suddenly got a score from 80 to 75
Thanks bro..GOD BLESS YOU🎉
What did you click after coping the normal distribution ?
My f4 button is not working. Is there another way i could freeze the mean ang standard deviation
F4 didn't work for me either. I have to press function (fn) and F4 together.
nice... thank you..!!!
what did you click after selecting the data in order to get the std devation ?
Hello Mohammed. I pressed enter. Please retry and let me know in case of any challenges.
keeps saying too few arguments.... im screwed
my normal distribution is showing a log graph... help...
how do you smooth the bell curve in your example to be like your first example?
Great!!
my curve is not belling lol lol
thank you so much guruji your a genius
why you used standard deviation for sample for marks
This is the best tutorial I found. Keep up the good work. Great going!
how is this done for a two tailed t-test?
Truly great effort and I still have few questions.
Q1. Area , SD, %age and values significance?
Q2. How are we using Mean and SD in Bell curve ( I believe Mean should be peak of this curve a line in between and SD the gap between intervals on X Axis. Need more on this.
Q3. NormDist is plotted on Y Axis....But what does it give to me? What is its significance?
Q4. What is the usage of this Curve/ Bad and Good Curve?
Thank you
Thank you, sir
fantastic!
Obrigada
Thank you it was very helpful.
Please Sir, on EViews how can we do a forecast by distribution?
Thanks, this was helpful
Amazing presentation
Fantastic explanation...keep it up
Thank you so much ...
Nice Video
i love u
Using the FALSE function might lead students (e.g., me) into thinking these normal distribution values are the actual probabilities (or you might also call it "areas") of getting data less than or equal to the raw data that corresponds to a z-score. I hope you could explain this more thoroughly. Still, thanks for the video!
1:50
how to freeze the cell
F4
how do i work if the data is values? instead of numbers , i have two columns with dates and sales value