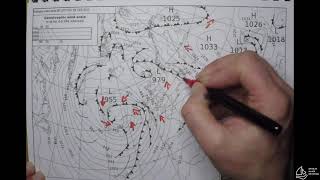
8:21 in this map, on the upper left side, the isobars and the isotherms are parallel to each other, while on the upper right they are perpendicular to each other. Do they have any unique characteristics?
If all the chart isobars represent the 500 mb at upper level so, how we can determine somewhere as a low or high pressure at upper level chart(500mb) ?? Thanks in advance
Thank you. Great session! @5:50 How do you know if it is high or low pressure from the elevation? @3:42 Plus, what pressure doe Mennisota have? Thank you!
Nice Video. I couldn't understand the upper level pressure map principle and now I got it. Once question though. What affects more the ISOHYPSES? The tempreture or pressure?
awesome video. I don't understand why the wind follows the isobars on the 500 mb chart though? I understand that it flows from high to low on the surface pressure map (deflecting to the right a bit from coriolis effect, and of course following surface contours, etc)... but what's going on in upper atmosphere to make it follow the 500 mb elevation isobars?
Millibars are a measure of pressure at any height. For upper level charts, we map the height of a given pressure surface. So, a 500 mb map gives you the height of the 500 mb pressure surface.


Thank you so much. You just helped me save my semester.
Very helpful!
Very good, thanks a lot 🙂.
Thank you so much for very clear explanation!!!
8:21 in this map, on the upper left side, the isobars and the isotherms are parallel to each other, while on the upper right they are perpendicular to each other. Do they have any unique characteristics?
If all the chart isobars represent the 500 mb at upper level so, how we can determine somewhere as a low or high pressure at upper level chart(500mb) ?? Thanks in advance
Fantastic video, thank you!!
Thank you Dr. Richard. I'm working through the Advanced Fire Weather Forecasters course and this has really helped my understanding!
Thank you. Great session!
@5:50 How do you know if it is high or low pressure from the elevation?
@3:42 Plus, what pressure doe Mennisota have?
Thank you!
Nice Video. I couldn't understand the upper level pressure map principle and now I got it.
Once question though. What affects more the ISOHYPSES? The tempreture or pressure?
you have saved my grades 😭😭😭 thank you soooo much!!
This is a good video thank you. for this video.
awesome video. I don't understand why the wind follows the isobars on the 500 mb chart though? I understand that it flows from high to low on the surface pressure map (deflecting to the right a bit from coriolis effect, and of course following surface contours, etc)... but what's going on in upper atmosphere to make it follow the 500 mb elevation isobars?
Michael Lawrence man. Great question. I wish it was answered
Friction
same question
The balance between Coriolis force and the pressure gradient. Friction can be neglected at that level.
@@edson1345 sorry but how does it make the wind follow the isobars?
what is absolute value of relative/absolute vorticity on the NOAA constant pressure charts.........
also curious about the big N's and X's
Thank you professor.
Are millibars a measurement of height or air pressure at a specific height or both? Thanks for whatever info you can provide me with.
Millibars are a measure of pressure at any height. For upper level charts, we map the height of a given pressure surface. So, a 500 mb map gives you the height of the 500 mb pressure surface.
@@gigirichard6456 Thanks for the explanation, much appreciated.
Great teaching, thanks!
how do you see the wind speeds?
Thank you for helping me
🙂🙂🙂🙂
Great explanation...
Can you post some material on calculating center pressure valve (i.e eye pressure valve during cyclone) from surface weather map
I teach 8th grade Earth Science and was wondering if you are flipping your classroom? If so, how is it going?
Tynx mam...
You deserve a sub! Can you do a significant weather chart?
Really wanna follow so bad but just didn’t gonna watch again