Frequency Distribution Table for Grouped/Continuous data | Math Dot Com

HTML-код
- Опубликовано: 26 апр 2019
- How to make frequency distribution table for Grouped or Continuous data is explained with example.Frequency distribution of a variable is classified as:
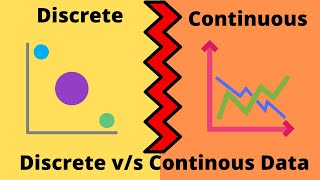
1)Discrete Frequency Distribution (Ungrouped)
2) Continuous Frequency Distribution(Grouped)
For Discrete frequency distribution of a variable please refer below link.
• How to Make Discrete F...
In this video continuous frequency distribution of a variable is explained with example.Continuous frequency distribution is also referred as grouped frequency distribution.As data is represented in the form of intervals .So three steps are mentioned for making the frequency distribution table of a variable with a large set of values.
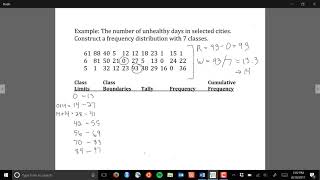
Step#01: Find Range of given data.
Range=X(max)-X(min)
Step#02: Decide the number of classes k .As it varies from 5-20 depending on the size of data.
Step #03: Find class interval by using formula as
h=Range/k
Than make the frequency distribution table using above calculated values.
#FrequencyDistribution,#GroupedData,#ungroupedData,#Discretedata,#ContinuousData,#FrequencyTable
For more videos please subscribe our channel....
👇👇👇👇👇👇👇
☑ 👉👉Subscribe : / @mathdotcom


Very informative... Stay blessed
As Mr. Khan has indicated 7 months ago, this is an example of quantitative "discrete" data, not continuous. Add some decimals to the recorded data and we can call it continuous.
thank you so much ma'am ur a life saver :D
Thanks mam
Amazing 💫
Thank you! Cheers!
It is an example of Discrete data.
the values are discrete.How is this a continuous distribution then?
Madam. you are saying that keep size of class 9
Then how 5-13 =8
And last step=41-50=9
Plz slove my doubt
I don’t understand step 2? 😢
Hi, why did u add 8 to 5 and make it 5-13 isn't it supposed to be 5 - 14
It is 5+9
@@justenmart.camingawan2133 But if you add 5+9 then the result will be 14
It is inclusive table
3 is the minimum value its beside5
dude it is 33 and 37 check it!
madam it is frequency table for discrete data
Not for discrete but for continuous
It is descreted data