Best explaination, i finally understand. Do you have video about R and it's relation to the R^2? I have seen the video of Veritasium about IQ where he shows the graph with regression and tell labout getting R^2 from R. I wanted to undrstand both, now i know what is R^2, R left.
I don't have a video on the correlation coefficient r. It's just the square root of R^2, but r will be either negative or positive depending on whether the line is going up or down. For example, if R^2 = 0.49, then r will be either 0.7 (for a line that is going up) or -0.7 (for a line that slopes downward). So r gives you a little more information (the direction), but it doesn't have an easy interpretation - 0.7 doesn't really "mean" anything. R^2 is a little more general, because R^2 exists for any type of regression model (multiple regression, or more complicated forms of regression), whereas the correlation coefficient r only applies to simple linear regression where there is 1 predictor variable.
We don't - I just made those numbers up for the example for easy computation. In reality, we will use the least-squares regression line (which in this example was the predicted weight = -439.286+8.929*height). That's not obvious at all, you'd have to have the data and compute a regression line.
For simple linear regression, r is just the square root of R^2. They are the same thing basically, except r can be positive or negative, which tells you the direction of the relationship. It doesn't really have an interpretation - values close to 1 are strong correlation. Values close to 0 are weak correlation.
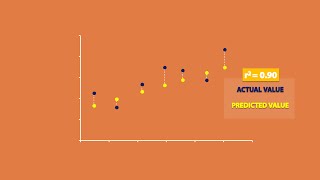
@@statswithbrian But the regression here is drawn with origin as 0. also the regression line is cutting the Y axis somewhere between 50-100, lets assume 75. so it shows when x=0, y=75, which basically is the intercept. I am a bit confused on this. how is the intercept -500 and the graph shows something else
The graph doesn’t show the x=0, so you are reading the graph incorrectly. The equation is correct and you understand the equation correctly, but you are reading the graph incorrectly. There is no y axis.


this is crystal clear explaination
FANTASTIC EXPLANATION!!!!!!!! Can't get any better.
Very crisp and clear. Loved it! Thanks Brian!
Thank you for this! Very helpful.
Good content and a nicely structured.
This is the most amazing and simple explanation I've seen so far, good job mate.
Thank you, I appreciate it!
if I can i will give a 100 likes, best explanation that i have found for this topic so far
Fantastic sir. ❤ Thanks a lot 🙏🙏🙏
what a video!! , really appreciate your valuable effort
You should explain why the differences are Squared.
Great idea, Jim. That gives me an idea for a future video, talking about absolute versus squared differences and why we use squared errors. Thanks!
crystal clear explaination
crystal clear, well done!
Best explaination, i finally understand. Do you have video about R and it's relation to the R^2? I have seen the video of Veritasium about IQ where he shows the graph with regression and tell labout getting R^2 from R. I wanted to undrstand both, now i know what is R^2, R left.
I don't have a video on the correlation coefficient r. It's just the square root of R^2, but r will be either negative or positive depending on whether the line is going up or down. For example, if R^2 = 0.49, then r will be either 0.7 (for a line that is going up) or -0.7 (for a line that slopes downward). So r gives you a little more information (the direction), but it doesn't have an easy interpretation - 0.7 doesn't really "mean" anything.
R^2 is a little more general, because R^2 exists for any type of regression model (multiple regression, or more complicated forms of regression), whereas the correlation coefficient r only applies to simple linear regression where there is 1 predictor variable.
@@statswithbrian Wow, thanks for the answer. Now i understand.
You are the best.❤
wow Thankyou Brian, very clear explaination
good explanation
why we use a formula of (predicted weight = -500+10*height)? Why 500 and 10?
We don't - I just made those numbers up for the example for easy computation. In reality, we will use the least-squares regression line (which in this example was the predicted weight = -439.286+8.929*height). That's not obvious at all, you'd have to have the data and compute a regression line.
How is R different from r2? how do you interpret each?
For simple linear regression, r is just the square root of R^2. They are the same thing basically, except r can be positive or negative, which tells you the direction of the relationship. It doesn't really have an interpretation - values close to 1 are strong correlation. Values close to 0 are weak correlation.
@@statswithbrian Thanks Brian 🙂
can you explain why is your intercept -500? the diagram shows that the intercept of the line should be positive. so why is it negative?
The y-intercept is not shown on the graph at all, because the x axis only goes from 60 to 70. X = 0 is way to the left.
@@statswithbrian But the regression here is drawn with origin as 0. also the regression line is cutting the Y axis somewhere between 50-100, lets assume 75. so it shows when x=0, y=75, which basically is the intercept. I am a bit confused on this. how is the intercept -500 and the graph shows something else
The graph doesn’t show the x=0, so you are reading the graph incorrectly. The equation is correct and you understand the equation correctly, but you are reading the graph incorrectly. There is no y axis.
Thankyou very much......
At first I thought this was about R^2 like just the variable squared and not the regression coefficient. :-O
cheers
a.k.a brier score
Brier score is more specifically for predictions of binary events, but yes they are very similar!