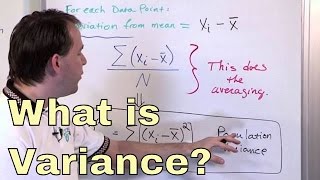
Also, the formula has x bar which is a sample mean but you’re using sigma squared for population variance. To keep up notation, use mu in the formula which is population mean.
If I pull a card to try for the ace of spades (1/52 chance) and I win $500 each time I do, and $0 all the other times, how do I calculate the variance? each pull would be 1/52 (not 1/52 then 1/51 then 1/50...)
This is a really good explanation! The best one that I've come across so far! No idea why the others are complaining. Question though: is the mean you have in your example (x bar = 2) the transformed mean? Because the sample mean is = 5
You are right the sample mean is 5 for these four data points, however I was just choosing an arbitrary mean for illustration purposes - you could imagine that this data is a subset of a larger data set. I should have made that clearer in the video!
The squaring is part of the process to make numbers positive: We ultimately want standard deviation which is a measure of the average spread of values from the mean. However, there will be values which are above the mean (i.e. will have a positive distance) and values which are below the mean (i.e. will have a negative distance) so when we add all these distances up to get the average spread there will be a degree of cancellation which we obviously don't want! e.g. if we had a value which was a distance of 5 above the mean and another value which was a distance of 7 below the mean (which would be measured as -7) then we want the average of these distances to be 6 but if we do the formal calculation for the mean: 5 + (-7) = -2 and so the mean would be -1 So to account for this we need a way of making all distances positive. The easiest way is to square and then immediately square root: e.g. if we had a distance of -3 then (-3)^2=9 and sqrt(9)=3 so we have made -3 into positive 3 and notice that the positive distances are unaffected by this process: e.g. if we had a distance of 4 then 4^2=16 and sqrt(16)=4 so the positive values are unaffected Thus if we square all distances, take the mean and then square root we will get standard deviation. The reason why we want to pause before we square root and call it variance is because it indicates outlier. e.g. if there was an outlier then it would be a long distance from the mean and so by squaring this long distance, this will be exaggerated
Maths Partner wouldn’t it make more sense to find the absolute value of each distance from the mean. That would give you the true average value of the difference between the values and the mean
@@ismaelcherif1375 You are right. There is a specific approach with absolute way as well. The squared process is used for outlier detection. also in regression analysis, ordinary least square (OLS) is the best way which minimize the squared sums of residuals to get the best fit. if you were to use normal absolute value, the minimize process cannot be done with normal calculus because it is linear and first differentiation is zero which requires linear programming method and yes there is such way as well to get best fit. OLS has some assumption and if those assumptions are met then OLS is proven to be the best method to fit a regression and define the causation and effect phenomena among data points. I truly appreciate your curiosity. i hope i was able to explain your question.
Hello , Thanks for this video , i want to ask about how to make videos like using a black background and with a pen , please advise for what product to use . Thanks
At the end where you compare the two with a random walk, you say Var is is the average of the whole distance, but the Stdev is "looking at the individual steps" - does this mean it looks a the average of the individual steps or something else? Can we say: Var looks at the average dispersion of the population while talking about Stdev, we would say, "if we look at any random step, how big do we expect it to be?"
One possible answer is to do with the speed and efficiency of computers since these are usually the tools that we use to process large volumes of data... Whilst a human brain may be able to instantly convert |2|=2 and |-2|=2, a computer needs a few lines of decision code to be able to take the absolute value by cases like this. For example: function(n){ if(n
@@MathPartner The reason we take the square is so that is is possible to take the derivative of the error around zero. This would not be possible for an absolute value plot which would come to a point around zero!
Hi, I have a doubt that why we need to consider mean in calculating variance and sd as mean can be easily affected by outliers, whereas the median is not so why mean is the basis of calculation.?? Help appreciated.
The truth is that you wouldn't use standard deviation as your measure of spread if you have outliers in your data. This is because SD is also influenced by outliers, regardless of the measure of central tendency you elect to use. Say we choose to use the median (or some other arbitrary value) as the central point in our data as you suggest... the SD would still be affected by outliers because it measures the average distance from the centre of the data i.e. outliers would still skew the distances from the central point! Given this, we just choose to stick with mean as it is quicker to calculate than having to order data and find the middle value. Instead, we can use a decision tree to help us decide which combination of central tendency and spread measures we could use: - No outliers: mean and standard deviation - Outliers: median and interquartile range NB: I am making various assumptions about the data here and there may be other justifications that you can use instead, but it is enough for a starting point.


Really good explanation.
don't be discouraged by anybody who says otherwise.
I don't understand why there is a lot of dislikes. This is a great explanation. Thank you!
Maybe because of the inaudibility of his voice.
@@obaidz1348 It's not bad at all.
Harry Potter explaining statistics! haha, genius! you sound exactly alike hehe
This was great and I think that this is an amazing video! Great job! You should be proud and you did a great job!
Also, the formula has x bar which is a sample mean but you’re using sigma squared for population variance. To keep up notation, use mu in the formula which is population mean.
You are quite right - thank you!
Great video! This just made everything very intuitive which rarely happens in Biostats for me! Thank you so much
really good explanation...thank you!
Thanks for the valuable breakdown. I get it.
Thanks for the Explanation 👍
If I pull a card to try for the ace of spades (1/52 chance) and I win $500 each time I do, and $0 all the other times, how do I calculate the variance? each pull would be 1/52 (not 1/52 then 1/51 then 1/50...)
This is a really good explanation! The best one that I've come across so far! No idea why the others are complaining.
Question though: is the mean you have in your example (x bar = 2) the transformed mean? Because the sample mean is = 5
You are right the sample mean is 5 for these four data points, however I was just choosing an arbitrary mean for illustration purposes - you could imagine that this data is a subset of a larger data set. I should have made that clearer in the video!
@@MathPartner oh perfect thank you!!
Thank you so much! this was really helpful:)
why do you have to even square it in the first space to get the variance? thats my question
The squaring is part of the process to make numbers positive:
We ultimately want standard deviation which is a measure of the average spread of values from the mean. However, there will be values which are above the mean (i.e. will have a positive distance) and values which are below the mean (i.e. will have a negative distance) so when we add all these distances up to get the average spread there will be a degree of cancellation which we obviously don't want!
e.g. if we had a value which was a distance of 5 above the mean and another value which was a distance of 7 below the mean (which would be measured as -7) then we want the average of these distances to be 6 but if we do the formal calculation for the mean: 5 + (-7) = -2 and so the mean would be -1
So to account for this we need a way of making all distances positive. The easiest way is to square and then immediately square root:
e.g. if we had a distance of -3 then (-3)^2=9 and sqrt(9)=3 so we have made -3 into positive 3
and notice that the positive distances are unaffected by this process:
e.g. if we had a distance of 4 then 4^2=16 and sqrt(16)=4 so the positive values are unaffected
Thus if we square all distances, take the mean and then square root we will get standard deviation. The reason why we want to pause before we square root and call it variance is because it indicates outlier. e.g. if there was an outlier then it would be a long distance from the mean and so by squaring this long distance, this will be exaggerated
Maths Partner wouldn’t it make more sense to find the absolute value of each distance from the mean. That would give you the true average value of the difference between the values and the mean
@@ismaelcherif1375 You are right. There is a specific approach with absolute way as well. The squared process is used for outlier detection. also in regression analysis, ordinary least square (OLS) is the best way which minimize the squared sums of residuals to get the best fit. if you were to use normal absolute value, the minimize process cannot be done with normal calculus because it is linear and first differentiation is zero which requires linear programming method and yes there is such way as well to get best fit. OLS has some assumption and if those assumptions are met then OLS is proven to be the best method to fit a regression and define the causation and effect phenomena among data points.
I truly appreciate your curiosity. i hope i was able to explain your question.
@@QuantCake247 You did, thank you for your reply!
This really helped, thanks!
Hello , Thanks for this video , i want to ask about how to make videos like using a black background and with a pen , please advise for what product to use .
Thanks
Hi, I use OneNote for the writing and OBS for the screen recording.
@@MathPartner thanks
Thank you so much!!! I finally understand.
It's a great explanation, the problem is it's inaudible.
This explanation may be easier to hear ruclips.net/video/SpY7CGekRBA/видео.html&ab_channel=MathsPartner
At the end where you compare the two with a random walk, you say Var is is the average of the whole distance, but the Stdev is "looking at the individual steps" - does this mean it looks a the average of the individual steps or something else? Can we say: Var looks at the average dispersion of the population while talking about Stdev, we would say, "if we look at any random step, how big do we expect it to be?"
Woah! This sounds like a good difference tbh
BRILLIANT !!!
I get that we square the difference in order to make it positive, but why do we not just take the absolute value? Squaring seems to be excessive...
One possible answer is to do with the speed and efficiency of computers since these are usually the tools that we use to process large volumes of data...
Whilst a human brain may be able to instantly convert |2|=2 and |-2|=2, a computer needs a few lines of decision code to be able to take the absolute value by cases like this. For example:
function(n){
if(n
@@MathPartner The reason we take the square is so that is is possible to take the derivative of the error around zero. This would not be possible for an absolute value plot which would come to a point around zero!
@@thomasstern6814 Yes, this is also true. Many thanks.
loved it
Hi, I have a doubt that why we need to consider mean in calculating variance and sd as mean can be easily affected by outliers, whereas the median is not so why mean is the basis of calculation.?? Help appreciated.
The truth is that you wouldn't use standard deviation as your measure of spread if you have outliers in your data. This is because SD is also influenced by outliers, regardless of the measure of central tendency you elect to use.
Say we choose to use the median (or some other arbitrary value) as the central point in our data as you suggest... the SD would still be affected by outliers because it measures the average distance from the centre of the data i.e. outliers would still skew the distances from the central point! Given this, we just choose to stick with mean as it is quicker to calculate than having to order data and find the middle value.
Instead, we can use a decision tree to help us decide which combination of central tendency and spread measures we could use:
- No outliers: mean and standard deviation
- Outliers: median and interquartile range
NB: I am making various assumptions about the data here and there may be other justifications that you can use instead, but it is enough for a starting point.
I got my answer
I am facing a problem in understanding what you are saying #saraikiLearning
Turn on youtube Subtitles and write down what he is explaining. You will get it. After spending 2-3 hours i am finally here and i got it
Thanks
Thanks
Sorry I can't understand what u mean
This explanation may be easier to understand ruclips.net/video/SpY7CGekRBA/видео.html&ab_channel=MathsPartner
Hey
worst lecture ever