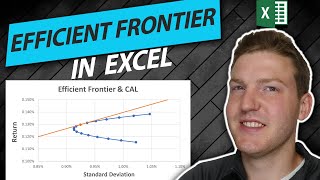
Efficient Frontier Explained in Excel: Plotting a 3-Security Portfolio

HTML-код
- Опубликовано: 30 июл 2024
- Delve into the world of portfolio optimization with our step-by-step guide on 'Efficient Frontier Explained in Excel: Plotting a 3-Security Portfolio.' Learn to calculate expected returns and standard deviation for individual securities, assign random weights, and effectively use the Sharpe Ratio and Covariance Matrix for risk management. We conclude with plotting the Efficient Frontier using Monte Carlo Simulation, helping you identify the optimal portfolio.
💾 Purchase the file created in this video here: ryanoconnellfinance.com/produ...
🎓 Tutor With Me: 1-On-1 Video Call Sessions Available
► Join me for personalized finance tutoring tailored to your goals: ryanoconnellfinance.com/finance-tutoring/
👨💼 My Freelance Financial Modeling Services:
► Custom financial modeling solutions tailored for your needs: ryanoconnellfinance.com/freelance-finance-services/
Chapters:
0:00 - Intro to "Efficient Frontier Explained"
0:41 - Calculate Expected Returns: Individual Securities
3:30 - Calculate Standard Deviation: Individual Securities
4:31 - Assign Random Weights
5:40 - Calculate Total Portfolio Expected Return
6:13 - Create Covariance Matrix
8:31 - Calculate Total Portfolio Standard Deviation
9:29 - Calculate Sharpe Ratio
10:42 - Plot Efficient Frontier Using Monte Carlo Simulation
12:17 - Find the Optimal Portfolio: Portfolio Optimization
*Disclosure: This is not financial advice and should not be taken as such. The information contained in this video is an opinion. Some of the information could be wrong. This channel is owned and operated by Portfolio Constructs LLC


💾 Purchase the file created in this video here: ryanoconnellfinance.com/product/efficient-frontier-mastery-excel-workbook-for-multiple-security-portfolio/
Very technical and instructive material.
Thank you William, I always appreciate your comments
I think you should be using sample variance (=VAR.S), not population variance(=VAR.P). If you are using the variance to impute your expected future returns, then you are calculating a statistic (i.e. from a sample) from which you can infer features of the population (i.e. all stock returns ever, including future returns). It doesn't really matter economically with as large a sample as you are using, but it is a statistically important concept. Choosing population vs. sample variance is not about the number of observations; it is about what we are using the point estimate for. Just my opinion. I love all of your videos, please keep it up!
Good call out, I'm in alignment with you! It is just a sample of the total population of returns so VAR.S makes more sense than VAR.P. I also agree that it won't make much of a statistical difference with samples of this size. I'm glad you're enjoying the videos 😀
Great video. Wish I had this video to guide me in 2021 when I was doing my FI 4000 project . 👍🏾👍🏾👍🏾
Thank you! It'll hopefully help the next person trying to complete a similar type of project
loved it
How did you add the yellow dot to the Frontier Graph?
I’d like to know it too
Thanks!
Thanks man! I think you're the 2nd person to ever send me a super thanks on here. Much appreciated
For the portfolio standard deviation, =sqt(mmult(mmult...etc, remember to press control, shift, enter, not simply enter. Good video and use of graphics.
control shift enter
Thank you! And good call out on that. For most people it won't matter but for people with older versions of Excel you are correct, control + shift + enter makes array formulas work
Hello thank you for the tip, it helps! However, when I press control, shift, enter, the value is then fixed and won't vary when changing my weight. Any idea why is that? Thank you for your help !
This is very helpful, thanks so much! I cross referenced your adjusted close prices for SPY and BND with Yahoo finance, and it looks like you might have used the close price. Is this working as intended?
support!
Thank you!
Hi Ryan, in a previous video, you calculated the daily returns of two assets using =(stock day price 2/stock day price 1)/2. How is it different in this case? Can I calculate the annual returns with this formula?
The other video was calculating daily returns as simple returns. This video is using log returns. Generally, log returns are recommended. I break down the differences between the two methods in great detail in this video: ruclips.net/video/ftXX4nZJ4pk/видео.html
@RyanOConnelCFA Could you explain why you multiply by 252 at the "Portfolio Summary-STD Deviation" because you already annulized the returns at the top and are using those to calculate.
Hello, the way you annualize standard deviation is to multiply the daily standard deviation by the square root of the # of trading days in a year. It is a totally separate calculation than the annualized return.
Ryan, I just recently got my bachelors in finance. Would I now be eligible to take the CFA technically?
Hi Ryan. Such an interesting video. I have very basic question. Why do you use sqrt(var.p)? There is a difference between var.p and stdev formulas in divisor - n and (n-1).
Hello! The reason we use the square root of the variance (sqrt(var.p)) to find standard deviation is because variance is the square of the standard deviation, which makes the standard deviation the square root of the variance. The distinction between var.p (population variance) and var.s (sample variance) comes down to the divisor-var.p uses 'n' for the whole population, while var.s uses 'n-1' for a sample, correcting for bias in estimating a population parameter from a sample
Ryan, thanks for the content! Question: I'm running a 4-security portfolio and my EF is plotting pretty lumpy and less frontier looking....any tips to what I may be doing wrong?
Thanks!!
Hi @zackploeger8451, thanks for your question! A lumpy efficient frontier could result from not having enough data points or the variance-covariance matrix not being accurately calculated. Make sure you’re using a sufficient number of return scenarios for your simulations, and verify that your variance-covariance calculations are correct for all securities. Also, consider checking the frequency and range of the returns data you are using. Fine-tuning these elements should help smooth out your efficient frontier plot!
Hi Ryan, thanks for this video.
I am studying variance and covariance among portfolio distribution, i would ask you if the procedure you explained to get the efficient frontier is considering the correlation/decorrelation between assets. Is that included in var/covar matrix? Sorry for dumb question, just learning 😅
Oh ok time to answer to myself. I think yes, covariance/variance matrix is already also a sort of "correlation" not normalised matrix which needs to be multiplied for assets weight in order to catch up the whole portfolio variance. I hope this is correct :)
Absolutely, you've got it right! The covariance/variance matrix indeed incorporates the correlation (and decorrelation) among assets by measuring how asset returns move together, which is then used alongside asset weights to calculate the portfolio's overall variance, contributing to the construction of the efficient frontier. Keep up the great learning!
Hi Ryan, thank you for creating such a quality content over RUclips. I really like your videos on portfolio optimisation and efficient frontier. This is another amazing video. However, I think there are couple more steps that are missing in efficient frontier construction. 1) plotting Global Minimum Variance Portfolio, 2) introducing Risk free rate and CAL line that will connect to Optimal portfolio of risky assets. At that line any portfolio (combination of Risk free asset and risky assets) will be plotted. Could you please make a video on those steps? Or if you already have that video published, could you please share the link? Thank you.
Thank you! And it is my pleasure to create this type of content. I do not have a video on the Global Minimum Variance Portfolio but that is certainly a topic I can look into in the future.
As for the risk free rate and the CAL line as it relates to the Efficient Frontier, I have a video on that exact topic here: ruclips.net/video/dJipa0K64HI/видео.html
Thank you@@RyanOConnellCFA. One further question please. Multiplying daily returns and variances with 252 to annualise them is understandable, to account for only trading days in a year. Could you please suggest or make a video on how to annualise monthly returns and variances? In many videos, they are multiplying them with 12 (as there are 12 months in a year). It means even non-trading days are also being considered and no discount is being applied to them. Should not it be 8 or 8.4 (12 * 0.7) rather than 12? Which number would you use to annualise monthly data? Note: 252/360 = 0.7
Amazing video it has helped me an immense amount! I echo Mr Hailian's sentiments that demonstrating how to plot the Global Minimum Variance Portfolio would be very handy to see. You van identify the MVP easily from the SD but I couldn't figure out how to identify the weightings of that particular portfolio.
Ryan. Great video. A great follow-up for anyone who has watched the Excel Sharpe Ratio Optimization Video. Hats-Off to you, brother. By the way, I assume you live in the US. By any chance, do you live in Massachusetts?
Thank you, I appreciate that! I live in Dallas, Texas! How about you, Massachusetts?
Hi Ryan, the video is great and illustration is very clear! But just one question, why is the efficient frontier drawn in your another video just a curve (without any combinations under the curve), but there are many combinations under the curve in this video?
Hello! Good question, the videos both take a separate approach. The other video uses a 2 asset portfolio. This video uses 3 assets and a monte carlo method to simulate the returns. You could use a monte carlo method for a 2 asset portfolio as well, which would also result in having combinations under the curve like this video has
Hi Ryan, thanks a lot for this answer, it cleared up a lot of my confusion. But there is still a question, why is the frontier curve drawn so perfectly (no combinations below the curve) when Monte Carlo simulation is not used? Is it because the probability is not introduced, so the return is a definite value, under the condition of given variance?@@RyanOConnellCFA
@@yueming2548 I believe the higher number of simulations you use in the monte carlo simulation the more perfectly drawn the top end of the curve will appear to be. Due to the law of large numbers, you will fill in the gaps at the top of the curve. You could test this theory out by running a lower number of simulations.
Great! Thanks Ryan. Very Helpful!@@RyanOConnellCFA
hi Ryan, first of all thanks for all these videos I'm an Italian finance student and I often find your videos much more interesting than the courses I'm studying. I would like to ask you if you have any advises on how to resolve this excel error, trying to build the covariance matrix excel says "Input range must be contiguous". I've copied your whole layout so i really don't understand. Thanks!!
Thank you for your nice feedback! Unfortunately I have not faced that error myself , nor have I heard of it, so I'm not sure. You should try going step by step back through from the beginning as there will definitely be something that you missed
Hey, I just bought the file and having an issue with the hight numbers of simulation. Is there a way to delete a part/minimize the simulation to like 1000. My pc takes around 10 min for one calculation. 😢
Wow your laptop must be quite old! Thank you for purchasing the file. You could reduce the number of simulations to a lower number and follow the same steps that I have done here. You would just do it exactly as I have done in this video but only go down to the number 1000.
Hey Ryan, can you do a video including a portfolio with crypto? I’ve followed your model but the only difference with crypto is it trades 365 days a year so how do I go about changing the calculation and setup. I would love a video on this or if you could provide guidance as to how to change the formulas
Good idea for a future video and I can look into this topic in the future!
@@RyanOConnellCFA looking forward to it
Yes, I'd be interested in this as well!
Thanks for the videos Ryan!
it may be a bit of a digress, but in statistics, sometimes ln(odds) is used. Just like you used ln(return) in the video.
Interesting point! I'll look into it
Is it unusual for the efficient frontier to deviate from the shape you have in the video / textbooks? Mine looks more like a blob than a smooth frontier. Also, how come you are not setting the min/max weights as in the other video for solver? I notice that when I don't set that, it automatically allocates 100% of my portfolio to a single stock.
Hello Edward, I think it would be rather unusual for the Efficient frontier to look like a blob. It is hard for me to determine what is going wrong in your analysis unfortunately. You could add min/max weights to this analysis as well if you wanted to. The reason I didn't in this video is just that I already felt like the video was a bit long
11:07 Make sure to simulate both the variables together, similar to Mr. Ryan here. I was simulating the variables in different data tables and got the blob shape you're talking about.
@@yugarthsharma626 I appreciate you chiming in on this! It should help people in the future have the same problem
thank you for the video!! i have a question to 11:32 every time i do this, there will be all same answers. what did i do wrong? i followed the steps :(
Same as me. Have you solved that error?
Dear Ryan, how to create a Capital allocation line in case of three security portfolio?(in this video that Efficient Frontier always changes)
Hey there! Once you have found the optimal portfolio as I've described in the video you are currently commenting on, you can follow the methodology that I used in this video to graph the capital allocation line on top of the graph: ruclips.net/video/dJipa0K64HI/видео.html
Thank you , got it@@RyanOConnellCFA
Can we apply this methodology for options?
Hi @bemineni, thanks for your question! While the Efficient Frontier methodology is typically applied to portfolios of stocks or bonds, it can be adapted for options. However, the calculations become more complex due to the non-linear payoffs of options. You would need to consider the specific characteristics of options, such as their Greeks (Delta, Gamma, etc.), and possibly use simulation techniques to estimate expected returns and variances
Hi Ryan, my weights will not add up to 100%. What could I be doing wrong?
Hi @miklosszabo5622, it sounds like there might be an issue with how the constraints are set up in Solver. Make sure that you have a constraint in Solver that specifically states the sum of the weights must equal 100%. If the weights aren’t adding up correctly, double-check that this constraint is active and correctly entered, and ensure all cell references are accurate. Let me know if you need a step-by-step walkthrough to adjust this setting!
Im trying to make the 5000 Simulation, but it doesnt change the numbers. It keeps copying the numbers from the Portfolio/ Simulation Row. What am I doing wrong?
It is really difficult for me to tell from this comment, all I can say is to re-trace your steps and try to do every single step exactly as I've done it in the video and you should not have any problems
I have the same problem
Same here. Is there a cell formula that was assumed?
@@devilsfoodkitchen, that's because you have to pay attention to what's in the video: In *Data Table* window you must keep you cursor flashing not in a *Raw input cell* box as you do but in a *Column input cell* one instead.
Hope this helps.
@@MSM5500 I don't get it .. I have the exact same issue
Excellent. Can you replicate it in python?
Excel and python can do the same things however people who use excel do not want use python and vice versa. These okes creating programs has to stick to the same terminology. It's getting ridiculous
@aarondelarosa3146 that video is on my to do list for down the road!
@@RyanOConnellCFA I can't wait!
Is plotting a 4-security portfolio any different?
I got a linear shape... and I can't seem to know where went wrong
It is hard for me to diagnose your issue just from this. I would advise you to start from step 1 and go step by step and check each one to ensure that you have done it exactly the same. You'll likely come across your error this way
Hi Ryan, thanks for the reply. Could it be the data set that is the issue? What are the reasons for the graph being a straight line?@@RyanOConnellCFA
@@spideyfanboy That seems unlikely that it would be the data set. If every security is perfectly correlated with every other security then it is possible. You could test this using =CORREL()
Maybe the correlation between the securities is near to 1, which means they tend to vary in the same direction and at the same unit. This is about the choice of securities and imply that the portfolio is risky and not diverse. It can be fixed by eliminating 1 or 2 and adding other ones.
How about Portfolio with 25 assets? I've done it...😅
I'm trying 7 an my EF is plotting extremely clumpy....any ideas??