Correlation in Excel

HTML-код
- Опубликовано: 11 сен 2024
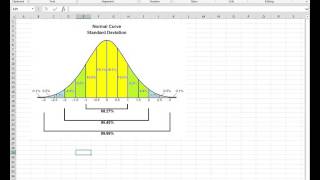
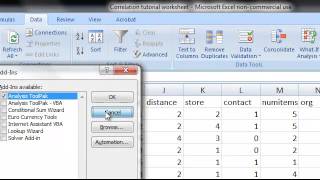
- I show you how to conduct correlations in Microsoft Excel. It's a little tricky, as Excel doesn't give you the significance of the correlation. But, I show you how to do this via a neat intermediate transformation.
The equations I entered to calculate t are below:
=(r*(SQRT(n-2)) / SQRT(1-r^2))
which equals
=(0.60316 * (sqrt(28)) / SQRT(1 - 0.3638))


Thanks for this video. this video helps me a lot.
very clear. thank you!
I hope you all find this video useful! If you have any questions, please do drop me an email. And if the video has REALLY helped and you want to buy me a beer, please see www.paypal.me/JimGrange
Thank you soo much for this easy explanation!!
Glad you found it of use!
Very helpful, thank you!
Helped me a lot! Thanks!
Great!
hey! my p value is=1.83144E-06
t value is =5.16 , r=0.505 what should i interpret?
how we can compute this?
The "E-06" is scientific notation for "move your decimal point 6 to the left". Therefore, your p-value is 0.00000183. In other words, it is HIGHLY significant, p