Using Excel to calculate a correlation coefficient || interpret relationship between variables

HTML-код
- Опубликовано: 5 окт 2016
- #excel #correlation
alphabench.com/data/excel-corr...
Please SUBSCRIBE:
ruclips.net/user/subscription_...
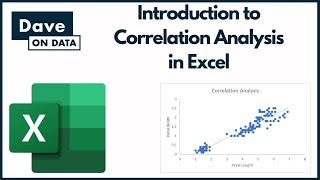
This tutorial demonstrates how to use the CORREL function in Excel to calculate and interpret the strength and direction of the relationship between two variables.
You may also be interested in Linear Regression:
alphabench.com/data/linear-re...
The spreadsheet used in this example can be downloaded from:
www.alphabench.com/resourses.html  Наука
Наука


![[ GUILTY GEAR STRIVE: DUAL RULERS ] Teaser Trailer](http://i.ytimg.com/vi/e4TDqaE3XAg/mqdefault.jpg)


It's currently 3:15 in the morning and I'm up doing an assignment using excel. Thanks so much Matt. I didn't understand a thing in my lecture but now I do😁😁😁
Glad it helped!
It's currently 2:27 in the morning and I am up doing a data task for an interview. Thank you a lot Matt for help!
@@arthurbukovetsky6322
hbu bbb hhbbbb
h
uh
hybbbh
hbbb
gn
b
huh
bbb
o
We all have work to do boo hoo, Ik I’m grumpy rn forgive me
It's 11 in the night, and Tomorrow 10 i have my exam...
🥲
But he saved me🙇
Very good, 5 min spent to remember the correl concept. Thanks for posting.
Glad it helped
Thank you, Matt! Just what I needed!
Glad it helped
Thank you. Perfect; covers all bases including reminders of how correlations should be interpreted.
Glad it helped
Amazing job Matt! Easy to understand and direct to the point. Great job
Thank you. Glad it helped
Clear and concise, thanks for posting.
Thank you. Glad it helped.
Much appreciated, Matt! This is the part of my Ph.D. I fear the most, but you just brought me some comfort.
Glad it helped
you get that PhD?!
@@Vec135 Hey. That is super kind of you to ask! I am in the final stage of the Candidate phase. Thank you. I am praying by the end of the summer if all keeps going as it has so far. Sometimes life gets in the way, but it has been relatively smooth so far (minus the unceasing stress, anxiety, worry, and 0300hrs study times. Lol. No. That is all part of the program. It must be earned.) Thanks again!
Thank you very much for this tutorial, it was extremely helpful.
Glad it helped
this video is very useful, thanks man
Thanks. Glad it helped.
Thank you for this video, it was simple and very well explained all the three scenarios.
Thanks. Glad it helped
Brilliant explanation, will never forget it.
Thanks. Glad it helped.
Honestly you saved me. I was confused with Eviews. I did it using Excel. Thank you so much. Stay blessed
Glad it helped
Thank you for explaining this so thoroughly, it really helped me understand what I'm doing.
Glad it helped
Great video man, thanks.
Glad it helped
Very informative video I appreciate you taking the time to explain this.
Thanks. Glad it helped.
Thanks a bunch...I struggled with that mammoth formula and my data size...your video was very helpful...
Glad it helped.
Thanks in a million. Awesome. Very well explained. Where have you been all these years.A+
Glad it helped
Thanks Matt.. that's just what i needed
Glad it helped
Thank u! u were so much help
Glad it helped.
great example showing what a positive and negative correlation look like
Glad it helped
Very helpful! Thanks Matt!
Glad it helped.
Thank you this video helped out a lot!
Glad it helped!
Very helpful video, Thanks!
Glad it helped
Hell yeah thank you! using may more numbers and larger values in the millions and this scales perfectly!
Glad it helped
Thank you for this, it use very helpful.
Glad it helped.
thank you for helping us out !
Glad it helped
amazing nice and quick just what i needed thank you!
Glad it helped!
Great video. Very helpful!
Glad to hear it!
Well done! You are doing good job.. Keep it up ❤️
Thank you. Glad it helped.
Thank u so much SIR, it is very helpful to me. 😍 🇮🇳 🇮🇳
Glad it helped
Hi Matt is it possible to undertake a correlation where the sample size variables are different?
Thanks for your question. Pearson correlation is calculated using pairs of data points so the sample sizes need to be the same.
Agreed very concise and to the point.
Thank you!
Glad it helped
Literally was about to cry because I didn’t get my hw but this helped!!!
Glad it helped.
Thank you so much for this.
Glad it helped
Thank you very much.
Glad it helped
Good video, thank you sir, from India
Glad it helped
Hi Matt, how did you get the positive and negative variable you have there?
Those are based on a quick linear equation with a random error added in.
Thank you for the video this video help me greatly 2023 Applied Statistics
Glad it helped
Thank you sir !
Glad it helped
nice teaching !
Glad it helped
thanks for video.
Glad it helped.
Very good., thanks
Glad it helped
God bless you
Glad it helped.
hello can I ask if where did you get the x and the none column. Because our professor only give us 2 samples
x is the independent variable, and the other three columns are examples of positive, negative and NO correlation. That's the one I labeled none. You can follow the link in the description to download the data file if that would help.
Thank you so much.
Glad it helped
Hi Matt, thanks for the video. What about yes and no column? Is that ok to replace them 0 and 1 and apply same process what you just explained?
Sure. I was just using that to show positive/negative correlations
Thanks! really helpful
Glad it helped!
@@MattMacarty yes! the explanations are clear and simple too! looking forward for more stat vids. thanks! more power
@@studywithyeya3052 Thanks. Glad it helped.
Thank you thank you
Glad it helped.
thank you for sharing the excel file too
You are welcome. Glad it helped
Thank you
Glad it helped
Character In the video It's great, I like it a lot $$
Glad it helped
Fthank you
Glad it helped
gracias dios por aparecer en este momento oportuno
voy a empezar a rezar
Glad it helped.
Could you please tell me how to activate function pane that you said?
Click on the fx button on the left side of the formula bar
Thanks alot.
Glad it helped
thanks
Glad it helped!
What if I have diff headings as 1 column had I'd no, 2nd one is ethnicity, 3rd one gender, 4 education level? And I wanna find corellation bw education level and gender then?
The process the same, only the column names have changed. You can also generate a table of correlations if you want: ruclips.net/video/DywVjSgkAR4/видео.html
Although this does not show how you get the little table that you have in your workbook, in there..
I just set that up ahead manually. I put a thick border and used cell styles.
if we compare the positive and negative correlation, the positive is stronger because its closer to one than the negative value (which is further away from -1)??? Right?
Yes
Hello sir how to find correlation and significance value between environmental variables and diversity indices
The procedure for correlation will follow the demonstration in the video. To test for significance requires a longer explanation. There are a couple of methods you could use but it is not something I can explain briefly here.
Do i need to see p value with this?
This is just showing the mechanics of correlation. p-value refers to testing correlation for significance.
Not sure if just me, but the link to the sheet doesn't seem to be working any longer
Hi. I just tested and it seems to be working: alphabench.com/data/excel-correlation-tutorial.html
Can't seem to find where to download the data, I keep getting sent in circles.
Sorry about that: alphabench.com/data/excel-correlation-tutorial.html
What would -0.249 be considered as?? Thank you
Weakish negative but likely significant
What would a correlation number of 0.48 be?
Do you mean how strong is the relationship? This is moderately correlated
@@MattMacarty Yes! Thank you
From where we get positive and negative ?? Column?
I generated the numbers randomly. To get a negative correlation you use the first column and the column labeled negative. Make appropriate change for positive.
can we find correlation to the letters?
I don't think I follow you.
@@MattMacarty i didn't understand?
I think he might be asking if it is possible to find correlations based on letters instead of numbers
VERY GOOD WORK BUT UNCLEAR VIDEO
Sorry about that. If you click on the little gear icon near the bottom of the video, you can select to view in HD which will clear it up
@@MattMacarty,Thanks
What is X referring to?
The variable on the x axis
@@MattMacarty Thank you so much Sir! Now I can finish my output in Statistics.
Is 0.222 is good relationship?!
So I wouldn't characterize relationships as good or bad. Maybe weak or strong or significant. The number in isolation doesn't tell me much, but I would presume that at the very lest this correlation is significantly different from 0.
I hate Excel☺️
Sorry.
Thank you !
Glad it helped