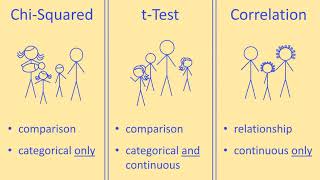
Paired t-tests: testing statistically whether two paired groups are related

HTML-код
- Опубликовано: 22 авг 2024
- This RUclips video presentation explains how to test statistically for differences between 2 groups using the paired t-test.
It outlines what is meant by hypothesis testing and how hypotheses can be worded when using t-tests.
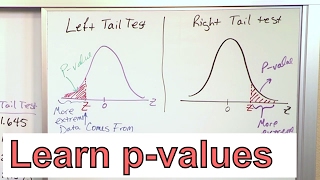
Next it considers the components of a t-test, namely the t statistic, the degrees of freedom and the probability of the test statistic or one more extreme occurring by chance (p value).
The application of the paired-test is illustrated using an example drawn from testing the impact of a customer services training course on employee sales. First the data matrix is explained including how the paired t-test uses pairs of quantitative data for each case. Next the assumptions of the test are outlined, including when these can be relaxed.
The test statistic and its interpretation is then explained, including how to report this in a project report or dissertation or thesis.
Further reading is outlined.