T-test, ANOVA and Chi Squared test made easy.

HTML-код
- Опубликовано: 27 сен 2024
- Statistics doesn't need to be difficult. Using the t-test, ANOVA or Chi Squared test as part of your statistical analysis is straight forward. You do need to understanding the underlying principles of hypothesis testing and p-values of course. You need to understand when to reject the null hypothesis and accept the alternative hypothesis if you are going to make any inference about the population from your sample data. If you are doing any data analysis or statistical analysis then this video is a must. If you are an aspiring data scientists or doing quantitative research, then this is a good place to start.
SUBSCRIBE:
--------------------
Click here: www.youtube.co...
BECOME A MEMBER
---------------------------------
/ @gregmartin
This channel posts global health and public health teaching videos and videos about how to find the right job in global health. If you haven't already, please consider subscribing to this channel and becoming part of this community. The channel also provides teaching on research methods, statistical analysis and how to write and publish a scientific paper.
LETS CONNECT:
---------------------------
Twitter: @drgregmartin
Linkedin: / drgregmartin
Facebook: / thisweekinglobalhealth


Get my FREE cheat sheets for Public Health, Epidemiology, Research Methods and Statistics (including transcripts of these lessons) here: www.learnmore365.com/courses/public-health-epidemiology-research-methods-and-statistics-resource-library
It's not "Super Duper Easy" but you made it easier. Thank you sir
So nice of you! Always happy to help. Thank you for the amazing feedback!
Ryan Reynolds teaching me stats is the best combo I could ask for !
Thank You so much!
😄 Absolutely thrilled you enjoyed it!
Thank you Greg. This is the second of your videos on quantitative analysis I've watched, and I really like both your style and the pace at which you proceed through this stuff. It's ideal for me and for my current purposes - revising for work purposes, against a tight deadline, stuff I haven't done for many decades, and probably only half-understood at the time, .
Glad you like them! Thank you for your awesome feedback!
These vids perfectly compliment stats lectures. It’s easy to ignore the understanding/applications of stats when studying but these tie in an understanding of what I am actually doing
I had to watch the video couple of times and a playback speed of 0.5...
Concept is crystal clear now
Thanks a lot!
Glad it helped! Thank you
The code with statistical videos would make our day.
Greg,
Another solid video. One thing that I was taught in statistics is that we never accept the NULL hypothesis. We either reject it or fail to reject it. I guess it is because there is always a chance - even at p=0.05 that the hypothesis might be correct even when we reject it etc. (false positives and such). Also does the variance not have to be the same in these samples or populations that we compare?
you are correct, it it either we fail to reject or fail to reject.
Exactly what I was going to say when I heard his explanation of samples too unlikely to get when the null hypothesis is true. I would just add that we never ACCEPT the alternate hypothesis either, because that would lead to a lot of legal issues when there’s an error
@@razzle_gapl9639 I don't know if you have heard of a book called Fictitious Science which was written by a psychologist working in academia. It is a real eye-opener in regards to p-hacking etc.
Thank You. Your teaching style is excellent. I have had so many light bulb moments while watching your videos.
Love your videos, still! I always find your explanations the best ever.
Thanks for the work!
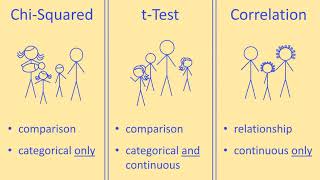
TIL when to use which test to check significance of hypotheses:
- If two means, then use paired t-test
- If three means then use ANOVA
- If more use Chi-squared
Let's see if my understanding needs to be corrected ; )
you got it but you don't always do a paired t-test for two means. I normal t-test is fine unless the two means are frame samples where the observations can be matched. So "before and after" for example. For each person in the "before group" he or she is matched with themselves in the "after" group.
Thanks for providing this tutorial, Greg.
Suppose we have a baseline data and post intervention data.
How can the following test of significance be performed in R or what kind of test is appropriate to perform?
T-Test to Determine the Statistical Significance of the Baseline Food Security
T-Test to Determine the Statistical Significance of the Post Intervention Food Security
T-Test to Determine the Statistical Significance of the Difference of Differences of Food Security
Hi Leleji,
First you need to determine the response Y you're intersted in for which you want to compare the difference in means between the two conditions (Baseline and Post intervention). To apply the t-test which is a parametric test, you data need to comply with certain assumptions namely independance and variance homogeneity and normality of the residuals. And no need to remind that the response Y should be Quantitative.
# R code
> t.test(Y_Baseline, Y_PostIntervention, alternative = "two.sided", var.equal = TRUE)
Hi Greg, this is another wonderful video. Please may I know what software you use for video editing as well as animations? Thank you in advance
Thanks for the vid! Tho could you maybe not use the scratching noice when putting new things in? It really is painful haha
Struggling to understand 😢
Nice video. It may be good to clarify that the assignment of the null hypothesis to a statement is arbitrary. For example if the "life expectancy" example was worded differently, the null hypothesis, H0, could have been "Mean life expectancy IS NOT the same" and H1 could have been "Life expectancy IS the same." The meaning of the null hypothesis in this case would have been flipped from the example the video.
Great point! Thanks for the feedback
First, thanks Greg. I have 32 patients, each with three changing coordinates over the course of 40 days. I mean, for each patient, I have 40 values on an axe x, 40 values on an axe y, and 40 values on an axe z. I have no idea what kind of test to use.
Very good video .... i really like the way u deliver in as much layman as u can
where can i get the dataset that you used in this video?
Thank you. These are perfect. Thank you for sharing your passion. I appreciate you.
Glad you like them! You are so welcome
At 06:30 why are you talking about paired test? These were different groups of people. Why do you think they are paired or linked?
Great Video. You should put time stamps in the video.
Great video. Pitty that your audio and sound effects are not great. Almost annoying.
I appreciate the feedback and will make sure to adjust the audio effects for a better listening experience. Thanks for pointing it out!
Thank you for your sharing.
how are you getting these numbers. its a lot information.
Thank you so much Greg. Great work.
This vid is legit.... please keep the good work!
That's kind of you to say - Thanks!!
How is a relationship based on a difference of proportions between samples. I think this is wrong
Hi Greg, I am curious about what tool you used for analysis in this video?
To someone reading this, pls helpp
I'll be doing two-sample t-test, but I don't know what variable i should use.
Our alternative hypothesis is: there is a significant difference between using manual method and using GCHM (our own grain-collecting machine) in collecting rice grains.
Thankyou, someone pls reply😢
is it wise to do a t-test in those life expectancies when those seems to be population density plots? we only perform tests if data are from samples right?
One thing missed is how to calculate the P values
Thank you very much. Excellent teaching video.
Thank you so much for the amazing feedback
I like this guy and was going to subscribe but the MUSIC has stopped me
sorry about the music.. will try to look at that :)
thanks for making it more complicated , or may be I'm too stupid for this
Great informative video Greg, thanks! One question - if your ANOVA result is significant, leading you to follow up with post-hoc tests, such as a t-Test with some kind of family wise error rate adjustment such as bonferroni, why bother with the ANOVA in the first place? Couldn't you just run the t-Tests and adjust the p-values for the number of tests (as per bonferroni), making the ANOVA redundant. I appreciate for lots of groups this would be time consuming but is that the only benefit of the ANOVA in that case, efficiency? I can't see how it offers any extra protection against type 1 error if the end result is to run t-Tests and report corrected p-values anyway? Appreciate any thoughts! Thanks and keep up the great vids.
I think this is a great question. I don’t know but perhaps skipping the ANOVA step and just doing many between-two-group comparisons would increase the risk of a type 1 error, and would be akin to data dredging? E.g., comparing samples from all Western European countries to see if life expectancy differs. Is the ANOVA step somehow ‘protective’?
low freq boost on voice processing enhances fumbling .
Thanks for the feedback
Greg, is there an online resource where I can practice questions about exactly which test to use in different circumstances?
Watching your videos has given me confidence, but I still want to test myself out..
I'll see what I can find and get back to you
@@gregmartin Thanks!
you’re an angel thank you so much
You’re welcome 😊
Awesome stuff, thank you!
Sir did you watch Deadpool
Finally, thanks !
:) Glad you liked it Sergio
Thank you so much
You're most welcome
धन्यवाद जी।
👏👏
Thanks
I have no idea why Deadpool is so good at statistics.
Thank You.
You’re welcome.
Thanks Mr Greg
Please I need this strategy of preparing lessons. I mean to say the vedeo editing
Noted
Thank you!
You're welcome!
very difficult to listen with all the stutter, uneven sound volume, and added sound effects
Thank
You're most welcome
the explanation was good but the music and the sound effect are really distracting i wish the video was without it
I appreciate the feedback, thank you!
Clear as mud champ! :(
I can't help but seeing a smarter version of ryan reynold teaching me
Thank you!
والله والنعم
How you can speak that fast, thinking fast
11:10
Nice but we can’t ever accept hypotheses, only fail to reject.
coool
maybe just me, this video is not very well explained for beginners, language description wise, maybe for people who has some basics. and 2nd half of video is more about coding instead of explain or summary from math perspective.
Not absolute beginner no, need some basic knowledge on statistical data analysis. Wouldn't say it's coding, the numbers may make it appear so but they're just outcomes of the test
❤️🔥
Thanks
You call this Explantation easy 😅
Nice but those statistics…. Not accurate
I wonder why he used European vs African life expectancy and not IQ as an example... ;)
Dear God, please help me! SMH
Anyone who says stats are uncomplicated, 'super-dooper easy' (!) has spectrally low levels of empathy. He then follows with a rapid-fire explanation and throws-in complex digressions...this is no teacher. If you are a teacher you know some things you should never say to learners, and you know how to modify your pace of delivery. This guy's an amateur.
hard to follow way too fast...dissapointing
How I wish there would be a translation of a video to support the channel. The channel is beautiful in science. Raising the number of views is suggested to you
Cc
Thanks. Will see what I can do.
Thanks!
Thanks a lot!
You're welcome!
you're single-handedly getting me through school
I'm so happy to be able to help! Keep up the great work
i had to research the appropriate stat tests with no guidance for my dissertation (not a biostat student). this short video put my mind at ease. thank you!
T-Test 00:43 ANOVA 7:56 Chi-square 11:00
Teaching is very good
Thank you! Glad to hear that.
your videos are amazing!
Glad you like them! Thank you so much!
Amazing! Not everyone teaches us say all possible scenarios of implementing each hypothesis test..very helpful!
Thank you
Great video, thank you
I had a quick question, can you explain the difference between a two independent sample with dichotomous outcome test and a chi-square test of independence that uses two independent samples? I feel like you can use both for the same data set. For example, prevalence of CVD among smokers and nonsmokers.
Thank you
Is anyone else here because of the Harvard sandal? While am still here thank you for this good explanation👏
Good day. Was wondering how I could carry out a T-test and anova using data gotten from bacteria culture
hi thank s for videos
i am wondering how minimum numbers of items i should take in my data to make test significant?
Thanks a lot Sir.
You’re most welcome.
Got it 💯
Keep it up!
Greg! Spectacular resource. Thanks!
What are those decimals on the y axis?
Poor sound quality
Helpful , thank you for this video 👍🏻
Glad it was helpful!
Super video- thank you
So nice of you - thanks, Ryan.
Not needed to speed up the talk. I would rather watch 2 minutes longer video.
Hi - this is so much easier to understand than my MSc lessons!
Just to check if i've understood...There's actually very little difference between a t-test and a chi-squared test and how you would check if you can reject the null hypothesis. If your p-value is less than your threshold of 0.05 then its significant and you can reject. It's just the type of graph due to the type of data used that changes? But if you're given the data in a table, the results you need (CI, p-value, SD, etc.) are the same?
I think you’ve got it! I have a video about hypothesis testing on my global health channel. You might like it.
@@gregmartin link to the other channel, Prof. Martin 🙏🏾
Yes i am reading the positive comments and yes i am grateful for this video but when you keep stuttering and repeating the same words 4 times a row, or using large connecting words, it is very difficult to understand what you are trying to convey, or I am just really dumb xD
Thank you for making this !!